Customer Logins
Obtain the data you need to make the most informed decisions by accessing our extensive portfolio of information, analytics, and expertise. Sign in to the product or service center of your choice.
Customer Logins
ECONOMICS COMMENTARY
Aug 04, 2025
Using PMI® survey data to rebalance a portfolio of country equity indices


In this paper we demonstrate how signals obtained from the country PMI data may be used to guide equity market investment decisions. In our back-tests on a hypothetical portfolio, the country rotation strategy delivered substantial excess returns since 2007 using historical PMI data.
In a similar vein to the sector rotation strategy we implemented on a theoretical long-only equity portfolio (see here), we use signals derived from our country PMI dataset to guide a hypothetical investment strategy across global equity market indices.
Given the importance of economic growth to asset allocation decisions, we set out to demonstrate the effectiveness of PMI data as a country allocation tool in a global equity portfolio.
Why use PMIs?
Many economic indicators are limited in their applicability to investment allocation decisions as financial markets will typically have already "priced in" the information they contain. This is commonly seen with official datasets such as GDP. Not only are they typically released with a considerable lag, but these measures are subject to revisions, published infrequently, and are also difficult to accurately compare across countries due to different statistical methodologies.
The PMI surveys are not susceptible to these weaknesses, meaning the surveys are widely viewed by economists, policymakers, investors and business leaders as credible benchmarks of economic conditions, providing timely information on macroeconomic fundamentals. Crucially, the PMI data contain new information and are therefore inherently market moving. It's typical to see PMI releases generate significant moves in FX, equity and bond markets upon release, for example.
Manufacturing, services and composite data are published at the beginning of each month, with 'flash' PMI data (typically compiled with 85-90% of final responses) available around a week prior to the final data. The timely monthly publication cadence, as well as the use of a consistent methodology across all surveys compiled by S&P Global, make them an excellent candidate for shaping country-specific views. Crucially, these data are fact-based, with the PMI survey's sub-indices derived from questionnaires answered by executive level staff with full oversight of critical business health barometers such as company output levels, order book volumes, prices charged, operating costs, and employment.
Additionally, the PMI survey panels are carefully constructed to accurately replicate a particular sector or economy in miniature, with company recruitment targets set and reviewed periodically to ensure precise representation. The PMIs typically also enjoy a strong and consistently high survey participant response rate of at least 70%. This provides users with an additional layer of confidence.
Methodology
i) Data
We build hypothetical portfolios —referred to as a PMI Growth Index henceforth — consisting of 12 different national MSCI equity indices. We use signals derived from the country-level PMI data to determine the allocation of funds into these 12 countries for the hypothetical portfolio. The performance of the PMI Growth Index is benchmarked against an equally-weighted index of these 12 national indices, as well as the MSCI World Index.
Our PMI Growth Index is adjusted 12 times per calendar year i.e. once per month following the release of the Composite PMI survey data for our chosen countries. Composite PMI data are typically released on the third working day of each month, but the precise date can sometimes change due to national holidays (or religious events). To accommodate, we set our portfolio rebalance date as the fifth working day. Further testing could be done to see whether additional alpha could be generated by adjusting the portfolio as close to the PMI release dates as possible, but this is beyond the scope of this short paper.
The investment process works as follows. PMI data for month t-1 are released at the start of month t. The portfolio is adjusted in month t, with returns realised in month t+1 after PMI data for month t are published and the readjustment process is repeated.
ii) Signals
PMI data measure month-to-month changes in a host of critical business health indicators, with many of its sub-indices providing useful signals for extracting information on the current and expected path of a country's economy.
There are many PMI sub-indices which can be used to extract investment signals. These include — but are by no means limited to — the Output Index, New Orders Index, Output Prices Index and the Future Output Index. These indicators capture aggregated trends in business activity, demand, company pricing power, and business sentiment respectively, and each of these factors can ultimately impact company, sector and country stock market performance.
PMI data are published as diffusion indices, meaning they are bound between 0 and 100, with the 50.0 level indicating no change compared to the previous month. The further above the 50.0 threshold, the faster the rate of expansion being signalled, while the further readings go into sub-50.0 territory, the faster the rate of contraction. With the exception of the Future Output Index (the only sentiment measure in the survey), all data are seasonally adjusted.
Often, the PMI is taken at face value and interpreted accordingly. For example, if the US Composite PMI Output Index recorded 54.0 for a particular month, this would signal an increase in US private sector business activity compared to the month before. It is also common to compare against index values in prior months. Let's assume that previously the index registered 52.0. Rising from 52.0 to 54.0 would signal an accelerated pace of growth In the US private sector economy.
From these two data points alone, we have extracted two important pieces of information on the current performance of the US economy. We have ascertained that it expanded on the month, and at a pace that quickened. These are two positive signals that are suggestive of positive macroeconomic tailwinds for US companies.
Importantly, the PMI allows us to compare these two signals like-for-like with other countries for which PMI data are available. This lends itself well to constructing a country-rotation portfolio, which will underpin our hypothetical PMI Growth Index as part of this test.
Country PMI Growth Index
It's important to preface that the signals used to build the PMI Growth Index are by no means exhaustive. We encourage interested PMI users to experiment with different signals, data transformations, and blends of sub-indices as alternative approaches could yield stronger excess returns, lower index volatility, or a more suitable risk profile. The purpose of this paper is to simply provide PMI users with a basic working example of an effective PMI-powered investment model.
Our research focused on countries with Composite PMI data available. To build our portfolio, we used the signals derived from the PMI surveys to select an MSCI country index (US$) for investment, and we then rotate between national equity markets depending on the PMI signals.
We focus on two PMI sub-indices in this paper —the New Orders Index and Output Prices Index. The countries we use for equity market investment are Australia, Brazil, Canada, Mainland China, France, Germany, India, Italy, Japan, Spain, the UK and the US.
Each month, we choose to allocate funds to a single MSCI country index, based on the country which exhibits the strongest "buy" signal, according to the PMI. While this does mean our PMI Growth Index lacks diversification, it means we are always following the strongest buy signal indicated by the data.
We will show results of two of the models we developed in our back-testing, with each using slightly different approaches. We calculate scores for each of the 12 countries using the following basic formula:
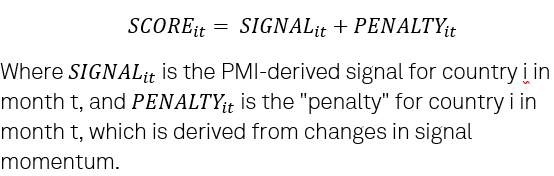
Scores for each country are calculated for every month going back to January 2007. The country with the highest score is selected for investment in that month, with funds reallocated should the highest-scoring country change.
Our first model experiments with a "switching" method using the New Orders Index and Output Prices Index as the underlying PMI datasets. We take the New Orders Index as our gauge of demand conditions, while the Output Prices Index provides us with an indication of corporate pricing power. We calculate SIGNALit and PENALTYit for both the New Orders Index and Output Prices Index.
To calculate SIGNALit, we take whichever index value of the two selected PMIs is the greatest in that month and divide it by 10 (giving a value ranging from 0-10), and we add the smallest value out of a newly constructed momentum indicator — PENALTYit — calculated by taking the latest PMI index value and subtracting its trailing three-month moving average. This means that countries are penalised for having negative momentum in demand or pricing power, which is, ceteris paribus, a negative macroeconomic signal.
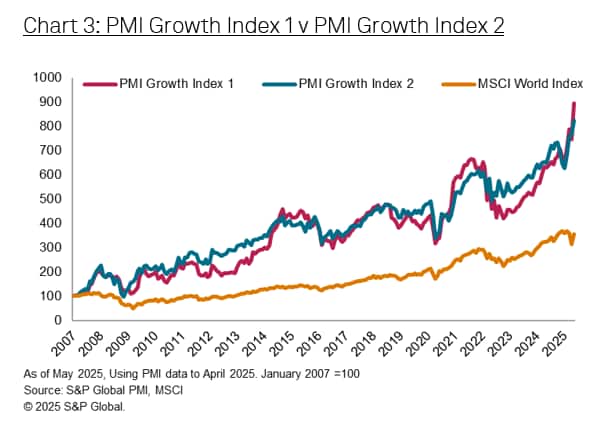
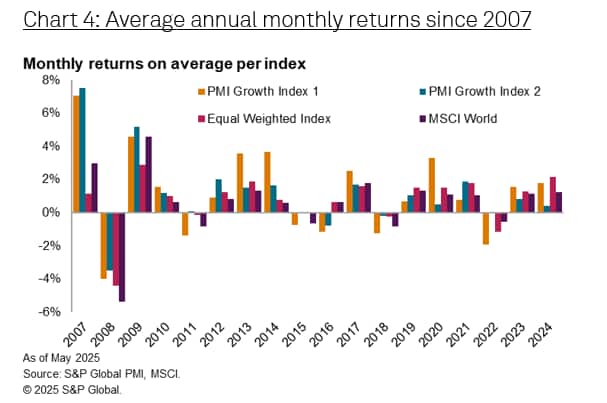
Using this methodology, the PMI Growth Index delivered excess returns of 537 percentage points (compared to the MSCI World Index) in our historical back test between January 2007 to May 2025, with the PMI Growth Index 209% higher than the benchmark.
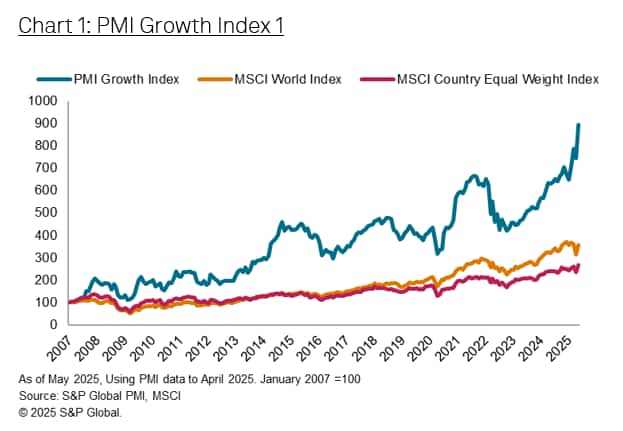
While this hypothetical model delivers substantial excess returns, it does result in some undesirably long periods of decreasing portfolio value, particularly between 2015 and 2016, 2019 and 2021, and 2022 and 2023. While these downturns occurred during periods of broader equity market decline, drawdowns in some cases were far more pronounced relative to the benchmark, potentially as a result of the lack of diversification in the index. That said, the index's performance during the recent equity market turbulence of April 2025 is significantly more positive than the benchmark.
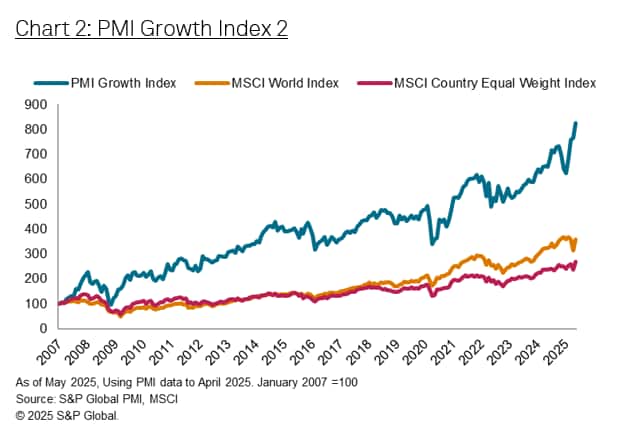
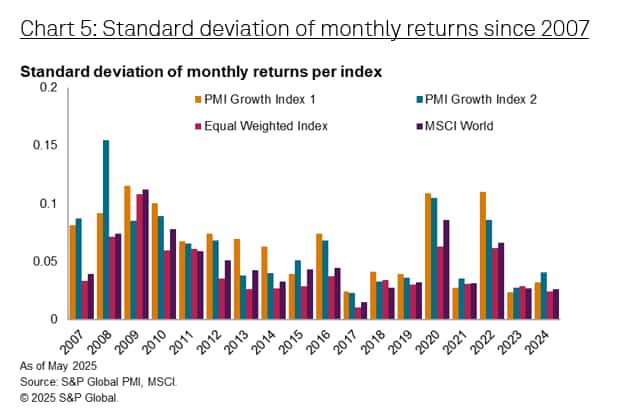
Changing our approach slightly, we drop the Output Prices Index and focus solely on the New Orders Index, or in other words, trends in demand for a country's goods and services. We also alter our score calculator, opting to take cross-sectional z-scores in each month across the 12 countries to calculate each of the corresponding SIGNALit and PENALTYit values respectively. This standardizes the variables and ensures they have a more equitable influence on SCOREit. These changes deliver some noteworthy improvements to the model, such as shallower declines, offering a more stable portfolio. This comes with the trade-off of achieving slightly smaller excess returns in our back-test period (467 percentage points), but factors such as shallower peak-to-trough declines and a lower index standard deviation may offer a more suitable risk-profile to some investors.
Country GDP Growth Index
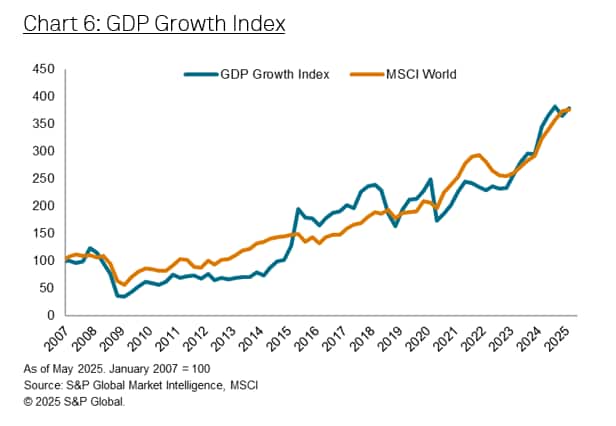
To further assess the PMI's effectiveness at guiding country equity market selection, particularly over other available macroeconomic statistics, we also run a back-test over the same sample period using signals extracted from quarterly GDP data for our 12 chosen countries.
We build a model which follows the same scoring principle we set out for our PMI Growth Index, using cross-sectional z-scores for quarterly GDP growth as a signal, and adding the cross-sectional z-score of quarterly GDP growth momentum (quarterly difference between rates of change) as the "penalty".
This model can only be adjusted four times per year, once quarterly country GDP data is released. Furthermore, given the release of GDP data across countries isn't synchronized like the PMI surveys, choosing a portfolio adjustment date is less obvious. We set our investment selection date to be eight weeks after the end of each quarter, as the first estimate of GDP can be released four to eight weeks after the end of the quarter. Our back-test also does not use the first estimate of GDP data, that may be preferred, due to difficulties obtaining this historical data.
We find that the GDP country rotation model fails to deliver excess returns that are comparable to those using the PMI surveys between 2007 and 2025, excess returns of just 0.7% are achieved using this approach in our back-test.
Conclusion
Using PMI survey data to guide country-level equity market investment decisions can potentially yield considerable excess returns. In the proof-of-concept indices demonstrated here, returns 537 percentage points greater than the MSCI World Index were achieved between a sample period of 2007 and 2025. The analysis indicates that the PMI is highly advantageous as a tool for financial market investment decisions, particularly when it comes to allocating funds at the country level, with a similar experiment also indicating advantages for sector rotation.
We urge financial market participants to experiment with building their own investment signals using the PMI data. The purpose of this paper was to demonstrate how the PMI data could be applied to build a working country rotation model which biases the equity markets of countries which show the strongest macroeconomic tailwinds relative to others. Work demonstrated here is most certainly not an exhaustive display of the PMI's potential in this space, with further testing encouraged using alternative scoring techniques, additional countries or different sub-indices.
Joe Hayes, Senior Economist, S&P Global Market
Intelligence
Tel: +44 1344 328 099
joseph.hayes@spglobal.com
Jingyi Pan, Economics Associate Director, S&P Global Market Intelligence
jingyi.pan@spglobal.com
Purchasing Managers' Index™ (PMI®) data are compiled by S&P Global for more than 40 economies worldwide. The monthly data are derived from surveys of senior executives at private sector companies, and are available only via subscription. The PMI dataset features a headline number, which indicates the overall health of an economy, and sub-indices, which provide insights into other key economic drivers such as GDP, inflation, exports, capacity utilization, employment and inventories. The PMI data are used by financial and corporate professionals to better understand where economies and markets are headed, and to uncover opportunities.
This article was published by S&P Global Market Intelligence and not by S&P Global Ratings, which is a separately managed division of S&P Global.
{"items" : [
{"name":"share","enabled":true,"desc":"<strong>Share</strong>","mobdesc":"Share","options":[ {"name":"facebook","url":"https://www.facebook.com/sharer.php?u=http%3a%2f%2fprod.azure.ihsmarkit.com%2fmarketintelligence%2fen%2fmi%2fresearch-analysis%2fusing-pmi-survey-data-to-rebalance-a-portfolio-August25.html","enabled":true},{"name":"twitter","url":"https://twitter.com/intent/tweet?url=http%3a%2f%2fprod.azure.ihsmarkit.com%2fmarketintelligence%2fen%2fmi%2fresearch-analysis%2fusing-pmi-survey-data-to-rebalance-a-portfolio-August25.html&text=Using+PMI%c2%ae+survey+data+to+rebalance+a+portfolio+of+country+equity+indices+%7c+S%26P+Global+","enabled":true},{"name":"linkedin","url":"https://www.linkedin.com/sharing/share-offsite/?url=http%3a%2f%2fprod.azure.ihsmarkit.com%2fmarketintelligence%2fen%2fmi%2fresearch-analysis%2fusing-pmi-survey-data-to-rebalance-a-portfolio-August25.html","enabled":true},{"name":"email","url":"?subject=Using PMI® survey data to rebalance a portfolio of country equity indices | S&P Global &body=http%3a%2f%2fprod.azure.ihsmarkit.com%2fmarketintelligence%2fen%2fmi%2fresearch-analysis%2fusing-pmi-survey-data-to-rebalance-a-portfolio-August25.html","enabled":true},{"name":"whatsapp","url":"https://api.whatsapp.com/send?text=Using+PMI%c2%ae+survey+data+to+rebalance+a+portfolio+of+country+equity+indices+%7c+S%26P+Global+ http%3a%2f%2fprod.azure.ihsmarkit.com%2fmarketintelligence%2fen%2fmi%2fresearch-analysis%2fusing-pmi-survey-data-to-rebalance-a-portfolio-August25.html","enabled":true}]}, {"name":"rtt","enabled":true,"mobdesc":"Top"}
]}