Customer Logins
Obtain the data you need to make the most informed decisions by accessing our extensive portfolio of information, analytics, and expertise. Sign in to the product or service center of your choice.
Customer Logins
ECONOMICS COMMENTARY
Jul 23, 2025
Using PMI® data to gauge the direction of the US dollar index

Purchasing Managers' Index (PMI) data are widely viewed by economists, policymakers, investors and business leaders as key benchmarks of economic conditions and serve as good proxies for fundamental changes in the investment environment, including within the foreign exchange (FX) market. The applications of PMI data in predicting trends in the FX market are known to be varied. In a paper published previously, we demonstrated the use of PMI data inestimating short-term FX equilibria.
In this note, we aim to further show how the use of a combination of PMI indicators can help guide investors in predicting the direction of trade for the broad US dollar index. By using a combination of PMI new orders, future output, selling prices and comment tracker data for the US compared to the rest of the world, our PMI-based indicator produced a win rate of up to 64% over the past three years using point-in-time testing. Further improvements in the results can likely be achieved with more sophisticated testing methods and better execution of trades.
The USD index and its key drivers
The US dollar (USD) is the most traded currency in the world. Established by the US Federal Reserve in 1973, the broad US dollar index measures the value of the US dollar against a basket of six major currencies (the euro, Japanese yen, British pound, Canadian dollar, Swedish krona and the Swiss franc), belonging to the US' most significant trading partners.
With fiat currency serving three primary functions - as a medium of exchange, unit of account and storage of value - on a fundamental basis, the value of the currency is tied to broader economic forces. Changes in economic conditions chiefly influence exchange rates, though different currencies also have their unique characteristics. For example, the US dollar is widely viewed as a traditional safe haven currency, making it attractive in times of global uncertainty.
US exceptionalism and haven status
Running on the two abovementioned assumptions, the US dollar should strengthen when the US economy is growing well, especially relative to the rest of the world, but also when heightened uncertainty invokes evasions to safety.
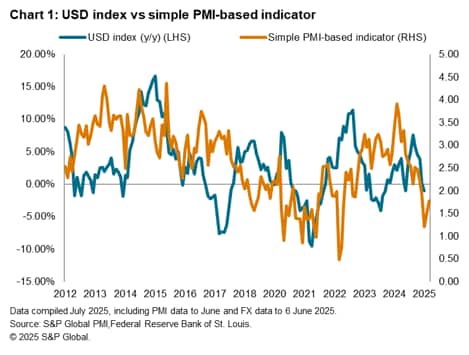
As such, we have selected two indicators to estimate the year-on-year changes in the US dollar index.
1) US-Global new order differentials
To estimate how the US economy is faring against the rest of the world, the PMI Composite Output Index is commonly be used for comparison. That said, the New Order Index, which assesses demand, is typically regarded as having leading-indicator properties for the headline index and may serve as a timelier indicator. In gauging how the US is faring against the rest of the world, we have taken the simple difference between the New Orders Index for the US and the Global-excluding-US aggregate.
2) PMI comment tracker total 'uncertainty' count
To gauge safe haven interests, we experimented with two different measures of sentiment.
First, one can proxy business confidence via the PMI Future Output Index, which measures companies' expected output in the next 12 months.
A second method is to use the PMI comment tracker data, which is derived from qualitative responses from the survey participants. Specifically, the series tracking total mentions of the word 'uncertainty' across all surveys was used, with a log transformation applied. The latter comment tracker data was found to be more superior in estimating the changes in the USD index.
The availability of data varies, with flash estimates of the US New Orders Index published around the third week of each month, while the comment tracker data are usually released only after the global data are published. To accommodate, we set the date to enter each trade on the 6th of each month, with the previous working day selected should the 6th fall on a non-working day. Here we have used the USD index data from the Reserve Bank of St. Louis, noting that actual performance may vary as FX is traded primarily over the counter (OTC).
Through a simple linear regression based on the two variables, we estimate the expected year-on-year change for the US dollar index according to the PMI signals of economic growth and uncertainty-driven safe haven status, choosing to go long if the index has yet to reach the target and vice versa. For simplicity, each trade is held for the entirety of the month until the next trade is placed, which means it may overshoot target or be closed out at a loss even if the target was achieved in the month. Through back testing over the period from May 2012 to May 2025, we observe a win rate of around 55% using this simple PMI-based indicator.
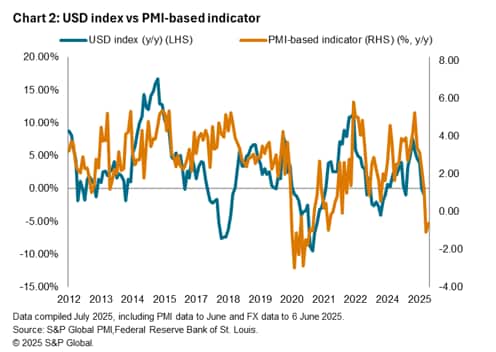
A multi-factor approach
While subjective, a positive win rate in the FX market may vary around 50% to 70%. To improve from the simple PMI-based indicator, we tested with other indicators and have found additional factors that helped to push the win rate higher.
3) US-Eurozone output price differentials
In addition to growth differentials, interest rate differentials play a key part in guiding FX movements. With the euro taking up the biggest weight in the USD index, we opted to track interest rate differentials between the US and eurozone by watching the difference in the US versus eurozone PMI Composite Output Prices Index, which serves as a good proxy for the inflation differential.
4) Mainland China Future Output Index
To also capture inflows and outflows of capital to relatively higher-risk markets such as the Asia-Pacific (APAC) and other emerging markets (EM), which can impact the greenback strength, we have also included the Composite Future Output Index from mainland China as a variable to estimate changes in EM market risk.
5) US policy mentions
Finally, given US policy changes in recent years, which play an important and growing role in guiding sentiment and demand for the greenback, we have included data from a custom PMI comment tracker, taking into account relevant keywords. Although relatively insignificant compared with other variables, we found that it had nevertheless helped to improve the win rate in the latest model.
Using the same approach for the simple PMI-based indicator, we were able to bring the win rate up to 59% over the same period.
A more realistic point-in-time testing over a period of three years dating back to May 2022 showed the recent three-year win rate at 64%, as compared to 56% for the same period with the earlier approach. The 64% result leans towards the higher end of the 50% to 70% range of a positive win rate.
Note that the 2017 period saw the US dollar lose strength amid mixed economic signals, political uncertainty and changes in investor sentiment. This has created a challenging environment for the PMI-based indicator to gauge the changes in FX, which can occur time to time.
All in all, the note here has demonstrated that, by using PMI data alone, investors can potentially obtain a valuable gauge of the direction in which the US dollar index may move in the month ahead. Additionally, the work demonstrated is by no means exhaustive and we encourage financial market participants to experiment with other combination of PMI sub-indices to further improve or tailor the results to their requirements.
Jingyi Pan, Economics Associate Director, S&P Global Market Intelligence
jingyi.pan@spglobal.com
© 2025, S&P Global. All rights reserved. Reproduction in whole or in part without permission is prohibited.
Purchasing Managers' Index™ (PMI®) data are compiled by S&P Global for more than 40 economies worldwide. The monthly data are derived from surveys of senior executives at private sector companies, and are available only via subscription. The PMI dataset features a headline number, which indicates the overall health of an economy, and sub-indices, which provide insights into other key economic drivers such as GDP, inflation, exports, capacity utilization, employment and inventories. The PMI data are used by financial and corporate professionals to better understand where economies and markets are headed, and to uncover opportunities.
This article was published by S&P Global Market Intelligence and not by S&P Global Ratings, which is a separately managed division of S&P Global.
{"items" : [
{"name":"share","enabled":true,"desc":"<strong>Share</strong>","mobdesc":"Share","options":[ {"name":"facebook","url":"https://www.facebook.com/sharer.php?u=http%3a%2f%2fprod.azure.ihsmarkit.com%2fmarketintelligence%2fen%2fmi%2fresearch-analysis%2fusing-pmi-data-to-gauge-the-direction-of-the-us-dollar-index-jul25.html","enabled":true},{"name":"twitter","url":"https://twitter.com/intent/tweet?url=http%3a%2f%2fprod.azure.ihsmarkit.com%2fmarketintelligence%2fen%2fmi%2fresearch-analysis%2fusing-pmi-data-to-gauge-the-direction-of-the-us-dollar-index-jul25.html&text=Using+PMI%c2%ae+data+to+gauge+the+direction+of+the+US+dollar+index+%7c+S%26P+Global+","enabled":true},{"name":"linkedin","url":"https://www.linkedin.com/sharing/share-offsite/?url=http%3a%2f%2fprod.azure.ihsmarkit.com%2fmarketintelligence%2fen%2fmi%2fresearch-analysis%2fusing-pmi-data-to-gauge-the-direction-of-the-us-dollar-index-jul25.html","enabled":true},{"name":"email","url":"?subject=Using PMI® data to gauge the direction of the US dollar index | S&P Global &body=http%3a%2f%2fprod.azure.ihsmarkit.com%2fmarketintelligence%2fen%2fmi%2fresearch-analysis%2fusing-pmi-data-to-gauge-the-direction-of-the-us-dollar-index-jul25.html","enabled":true},{"name":"whatsapp","url":"https://api.whatsapp.com/send?text=Using+PMI%c2%ae+data+to+gauge+the+direction+of+the+US+dollar+index+%7c+S%26P+Global+ http%3a%2f%2fprod.azure.ihsmarkit.com%2fmarketintelligence%2fen%2fmi%2fresearch-analysis%2fusing-pmi-data-to-gauge-the-direction-of-the-us-dollar-index-jul25.html","enabled":true}]}, {"name":"rtt","enabled":true,"mobdesc":"Top"}
]}