Customer Logins
Obtain the data you need to make the most informed decisions by accessing our extensive portfolio of information, analytics, and expertise. Sign in to the product or service center of your choice.
Customer Logins
ECONOMICS COMMENTARY
Jul 23, 2025
Using PMI® data to rebalance a portfolio of Asia sector equity indices


Introduction
In this paper, we demonstrate how signals obtained from the Asia Sector PMI data can be used to guide equity market investment decisions*. Similar studies have previously demonstrated the power of PMI data in active and systematic investment strategies at a country level and a global sector level. We now extend the application to Asia sectors and demonstrate how an active rules-based approach may help generate excess returns for equity market investors across different time horizons and with different degrees of diversification.
For this exercise, we use S&P Global Asia Sector PMI data, which provide insights into business conditions in 28 sectors with granularity down to three distinct tiers. Using 13 sectors and mapping them to the appropriate index within the S&P Global Broad Market Index (BMI) universe, we establish a sector rotation model which uses signals identified from the Asia Sector PMI to direct a hypothetical long-only portfolio. Through back testing the strategy, we find that our approach generated hypothetical excess returns as large as 332% over the benchmark S&P Pan Asia BMI Index over a 15-year period on a net basis.
Why use PMIs?
The Purchasing Managers' Index (PMI) is widely viewed by economists, policymakers, investors and business leaders as key benchmarks of economic conditions. In addition to the manufacturing, services and composite indices released on the 1st and 3rd working days of each month, S&P Global publishes more granular sector indices. This is available at a global level and regionally for Europe, Asia and the US.
The key advantages of using the sector PMI in driving cross-sector investment strategies can be summarised as follows:
- Availability: The S&P Global sector PMI data are unique as they provide regular insights into economic conditions by sector, with a broad range of sub-indices providing information on output, demand, prices, employment and expectations. With this, one can pinpoint the position of specific country or sector along the business cycle, which is crucial for investors' sector views.
- Comparability: PMI survey results are collated using a consistent methodology for all countries, regions and industries they track. As such, cross-country and cross-sector comparisons can be drawn.
- Timeliness: PMI data for each month are published at the start of the following month, which means that business conditions are tracked in near real-time, providing fast information for making investment decisions. Moreover, PMI data are not revised after first publication, providing an additional layer of confidence in decision-making.
Methodology
a) Data
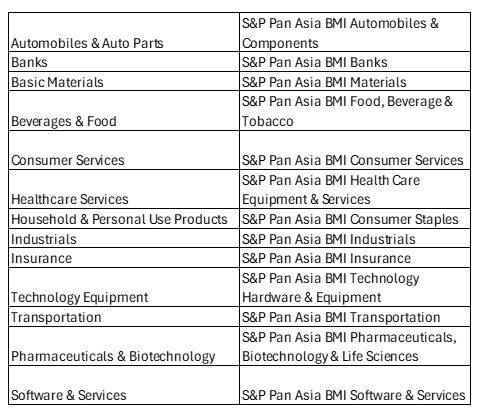
We use 13 sectors from the S&P Global Asia Sector PMI, mapped to the appropriate group within GICS® to identify which S&P Pan Asia BMI index will best capture the equity market performance of companies in that specific sector. They are listed below in table 1.
The Asia Sector PMI data selected here are used to construct an Asia Sector PMI Growth Index, whereby signals derived from these PMI data are used to determine the allocation of funds into these 13 sectors. The performance of the Asia Sector PMI Growth Index is benchmarked against both an equally weighted index of these 13 sectors, as well as the S&P Pan Asia BMI Index.
Our Asia Sector PMI Growth Index is adjusted 12 times per calendar year (i.e. once per month following the release of the Asia Sector PMI data). Asia sector PMI data are typically released on the third working day of each month, but the precise date can sometimes vary due to holidays (or religious events). To accommodate, we set our portfolio rebalance date as the 6th of each month, with the previous working day selected should the 6th fall on a non-working day. While not explored in this short paper, further testing could be done to see whether additional alpha can be generated by shifting the adjustment date as close to the PMI release dates as possible.
Like earlier papers, the investment process works as follows. PMI data for month t-1 are released at the start of month t. The portfolio is adjusted in month t, with returns realised in month t+1 after PMI data for month t are published and the readjustment process is repeated.
Table 1: GICS and S&P Sector mapping
b) Signals
PMI data measure month-to-month changes across a host of critical business health indicators, with many of its sub-indices providing useful signals for extracting information on the current and expected path of a particular sector.
There are many PMI sub-indices that can be used to extract investment signals, as demonstrated in past papers. Ones commonly used in our previous testing include, but are not limited to, the Output Index, New Orders Index, Output Prices Index and the Future Output Index. These indicators capture aggregated trends in business activity, demand, company pricing power and business sentiment respectively, all of which can influence company, sector and broader stock market performance.
PMI data are diffusion indices, which means they are bound between 0 and 100, with 50.0 the no-change mark. A reading above 50.0 indicates expansion, while anything below points to contraction. The degree of change is also well captured this way, whereby the further above the 50.0 threshold it goes, the faster the rate of expansion being signalled and vice versa. With the exception of the Future Output Index (the only sentiment-based PMI indicator), all data are seasonally adjusted.
We focus our research on allocating to the top performing sector(s) based only on signals derived from selected PMI indicators. We start with a single, untransformed PMI sub-index, before moving on to use combinations of PMI sub-indices and applying data transformations. PMI signals for each sector are ranked each month and funds are allocated to the top-performing sector(s) depending on the determined degree of diversification. Funds are reallocated each month should the top-performing sector(s) change.
In this paper, we experiment with allocating funds into the top three performing sectors for some degree of diversification. Results in a single-sector allocation scenario are also presented for comparison.
Findings
i) Single PMI sub-index
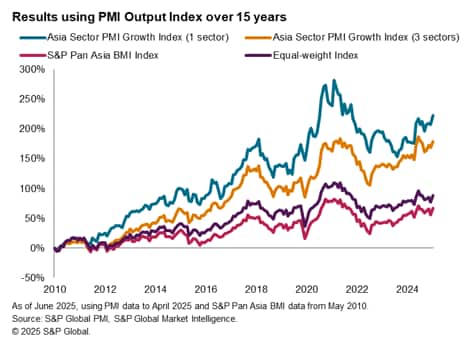
Output
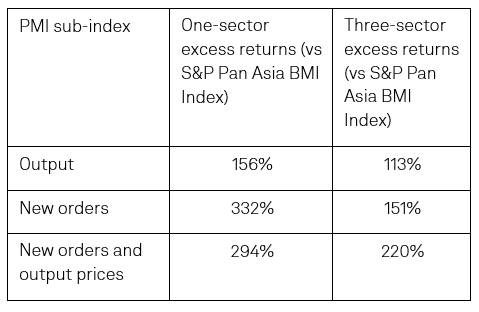
We start by using a single PMI sub-index, the PMI Output Index, which is a measure of business activity or production volumes (for manufacturing companies). Higher output is viewed as a positive investment signal, whereas lower output is seen to be negative. The chart below shows the returns comparing the Asia Sector Growth Index, for both the three-sector and single-sector portfolio, the S&P Pan Asia BMI Index and an equal-weighted index. Excess returns of more than 150% are achieved with the Asia Sector PMI Growth Index (1 sector), versus the broader S&P Pan Asia BMI Index. While this model delivers substantial excess returns, given it lacks diversification, periods of market downturn also become more pronounced, such as around 2021.
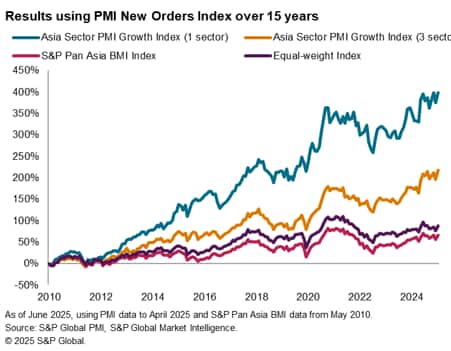
New orders
Substituting the Output Index with the New Orders Index, which is often seen as a more forward-looking indicator given it is a measure of changes in demand, the results visibly improved for both the three-sector and the single-sector Asia Sector PMI Growth Indices. The maximum drawdown has also declined by using the New Orders Index.
ii) Combination of PMI sub-indices
In previous papers, excess returns have been achieved by using transformations of the PMI sub-indices data to derive alternative signals for the allocation of funds across sectors. This included momentum signals, whereby PMI data for the month is compared with a moving average. This can allow us to better assess shifting business cycle trends, by analysing how a sector is performing relative to prior months.
In the selected model below, we used two sub-indices, applying the following formula to derive a score for each sector:

INDEX_it is simply the numerical value of a chosen PMI index in month t, while MOMENTUM_it is computed by subtracting the average of the prior three months from the current value of the chosen PMI index in month t.
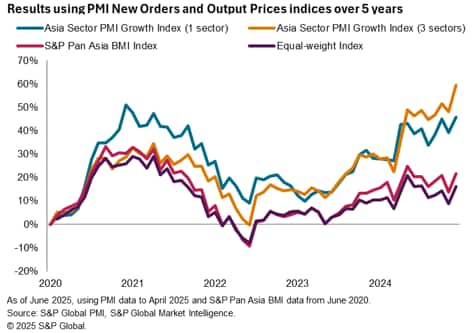
New orders and output prices
In this model, we have used the New Orders Index for INDEX_it, and Output Prices Index for MOMENTUM_it.
The rationale behind this specification reflects the value provided by demand signals outlined by the New Orders Index, but also the option to extract additional investment signals by looking at output prices which shed light on company pricing power. For example, if demand is expanding in a sector and we are also seeing evidence of rising pricing power, as reflected by upward movement in the Output Prices Index, one could expect better equity market returns given the PMI signals point to improved corporate earnings growth.
Here, substantial excess returns are again delivered using the blended PMI index approach. Notably, while the best-performing single-sector Asia Sector PMI Growth Index achieved higher excess returns over the same period using only the New Orders Index (as shown in the previous model), returns from the three-sector index derived from the blended PMI outperformed the single PMI index model which invests in three sectors. This is important for investors who value greater diversification in their portfolio.
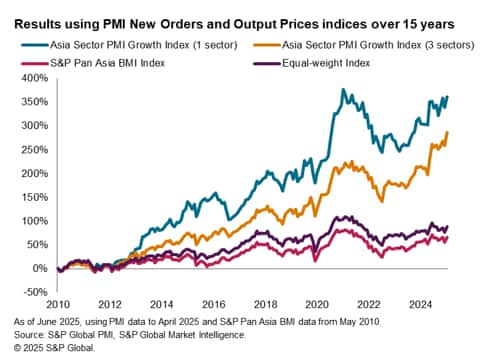
Table 2: 15-year period excess returns
We also shortened the investment horizon to a five-year period and once again found substantial excess returns. Moreover, over this sample period, the PMI-driven strategy avoided the negative returns in late-2022 when broad- and equal-weighted indices both fell into negative territory. This is important, as the past five-years have been unusual, especially in the immediate aftermath of the COVID-19 pandemic. The PMI therefore proved to be useful in guiding investment decisions even during periods of high uncertainty and market volatility.
Conclusion
This paper provides an illustration of how PMI data can potentially be used to guide sector-level equity market investment decisions to yield considerable excess returns. Even during periods of broader market decline, such as through the COVID-19 pandemic, we have shown that PMI signals can offer value to investors. This applies not just to Asia, but also on a global scale.
Theoretical returns over 300% greater than the S&P Pan Asia Broad Market Index were achieved over a 15-year period when invested funds were reallocated to the single best-performing sector over time, as determined by the PMI New Orders Index across 13 selected sectors. Blending PMI sub-indices also provide valuable investment signals, with returns from a more diversified portfolio outperforming the benchmark considerably over the tested sample periods. Our analysis shows the PMI is a versatile data set which is suited for different types of investment goals and strategies.
Lastly, the work demonstrated here is by no means exhaustive and we encourage financial market participants to experiment with other single or combination of PMI sub-indices to further improve or tailor the results to their requirements.
* Transaction costs and any other relevant fees and taxes have been excluded. Additionally, the use of underlying index data rather than index ETF data suggests that actual returns may differ due to tracking error.
Jingyi Pan, Economics Associate Director, S&P Global Market Intelligence
jingyi.pan@spglobal.com
© 2025, S&P Global. All rights reserved. Reproduction in whole
or in part without permission is prohibited.
Purchasing Managers' Index™ (PMI®) data are compiled by S&P Global for more than 40 economies worldwide. The monthly data are derived from surveys of senior executives at private sector companies, and are available only via subscription. The PMI dataset features a headline number, which indicates the overall health of an economy, and sub-indices, which provide insights into other key economic drivers such as GDP, inflation, exports, capacity utilization, employment and inventories. The PMI data are used by financial and corporate professionals to better understand where economies and markets are headed, and to uncover opportunities.
This article was published by S&P Global Market Intelligence and not by S&P Global Ratings, which is a separately managed division of S&P Global.
{"items" : [
{"name":"share","enabled":true,"desc":"<strong>Share</strong>","mobdesc":"Share","options":[ {"name":"facebook","url":"https://www.facebook.com/sharer.php?u=http%3a%2f%2fprod.azure.ihsmarkit.com%2fmarketintelligence%2fen%2fmi%2fresearch-analysis%2fusing-pmi-data-to-rebalance-a-portfolio-of-asia-sector-equity-indices-Jul25.html","enabled":true},{"name":"twitter","url":"https://twitter.com/intent/tweet?url=http%3a%2f%2fprod.azure.ihsmarkit.com%2fmarketintelligence%2fen%2fmi%2fresearch-analysis%2fusing-pmi-data-to-rebalance-a-portfolio-of-asia-sector-equity-indices-Jul25.html&text=Using+PMI%c2%ae+data+to+rebalance+a+portfolio+of+Asia+sector+equity+indices+%7c+S%26P+Global+","enabled":true},{"name":"linkedin","url":"https://www.linkedin.com/sharing/share-offsite/?url=http%3a%2f%2fprod.azure.ihsmarkit.com%2fmarketintelligence%2fen%2fmi%2fresearch-analysis%2fusing-pmi-data-to-rebalance-a-portfolio-of-asia-sector-equity-indices-Jul25.html","enabled":true},{"name":"email","url":"?subject=Using PMI® data to rebalance a portfolio of Asia sector equity indices | S&P Global &body=http%3a%2f%2fprod.azure.ihsmarkit.com%2fmarketintelligence%2fen%2fmi%2fresearch-analysis%2fusing-pmi-data-to-rebalance-a-portfolio-of-asia-sector-equity-indices-Jul25.html","enabled":true},{"name":"whatsapp","url":"https://api.whatsapp.com/send?text=Using+PMI%c2%ae+data+to+rebalance+a+portfolio+of+Asia+sector+equity+indices+%7c+S%26P+Global+ http%3a%2f%2fprod.azure.ihsmarkit.com%2fmarketintelligence%2fen%2fmi%2fresearch-analysis%2fusing-pmi-data-to-rebalance-a-portfolio-of-asia-sector-equity-indices-Jul25.html","enabled":true}]}, {"name":"rtt","enabled":true,"mobdesc":"Top"}
]}