Customer Logins
Obtain the data you need to make the most informed decisions by accessing our extensive portfolio of information, analytics, and expertise. Sign in to the product or service center of your choice.
Customer Logins
ECONOMICS COMMENTARY
Jan 20, 2020
US manufacturing sector ends 2019 on stronger note, in line with IHS Markit PMI signal

- Official data showed manufacturing output rising in December but declining slightly over the fourth quarter, in line with IHS Markit PMI survey signal
- Data add to signs that manufacturing is struggling rather than collapsing
US factories enjoyed a strong end to 2019, with output rising in both November and December. The year as a whole was nevertheless one of mild downturn after a strong 2018.
Output rises for second month running in December
Official data showed manufacturing output growing 0.2% in December following a 1.0% rise in November (revised down slightly from 1.1%). The improvement defied expectations among economists of a 0.2% decline, according to Reuters estimates, but confirmed the signal from IHS Markit's PMI survey data.
The December rise ends a fourth quarter in which manufacturing production dropped 0.3% compared to the third quarter. Output was also down 1.3% on a year ago, the second-biggest annual fall since August 2013, underscoring the recent weakness of production. Over the course of 2019, output fell 0.2% after a 2.3% rise in 2018, dropping in seven months and rising in just five, representing the first annual decline since 2016.
Some of the recent weakness has been due to strikes at GM factories, but even excluding autos, production ended the year 0.8% lower than in December 2018.
The official data therefore highlight how the US goods-producing sector has been struggling against the headwinds of weaker growth of global demand as well as heightened uncertainty in relation to trade and tariffs, which has hit both exports and investment.
Struggling not collapsing
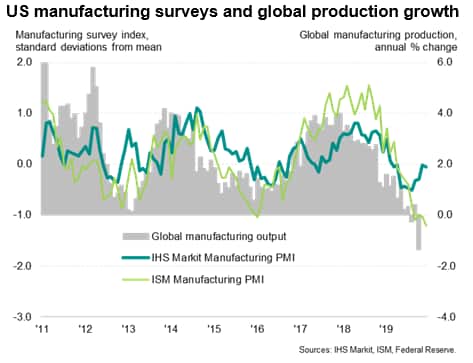
However, the official data also confirm that the contraction of the manufacturing sector has been only relatively modest, and that renewed signs of life were apparent at the end of the year. This narrative matches precisely that depicted by IHS Markit's PMI survey.
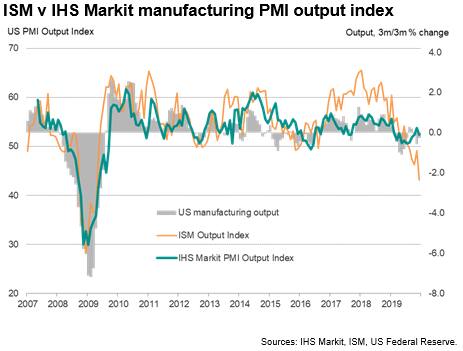
The manufacturing output index from the IHS Markit PMI survey had risen to a ten-month high of 53.7 in November before slipping back slightly to 52.4 in December, representing a relatively strong end to a year in which the index averaged just 52.2. That was down from a far stronger average of 55.2 in 2018 and 54.2 in 2017.
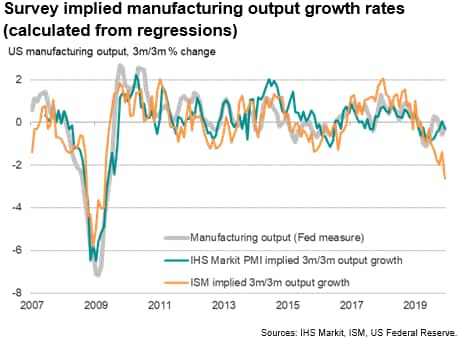
Translating these PMI diffusion index numbers into an actual output growth rate comparable to that calculated by the Federal Reserve can be done by a simple regression, in which the survey index acts as the sole explanatory variable of the actual quarterly change in production*. The regression has an adjusted r-square of 0.79 and produces the following conversion equation:
Output growth rate (3m/3m) = (PMI output index x 0.27484) - 14.7
The fourth quarter PMI output index average of 52.8 therefore equates to a quarterly output growth rate of -0.2%, which is very close to the official estimate of -0.3%.
The mild quarterly decline recorded by both the IHS Markit PMI and official data contrasts with a far steeper contraction signalled by the ISM survey data. The ISM's manufacturing output index fell to a decade low of 43.2 in December, averaging just 46.2 in the fourth quarter. Using a similar regression-based analysis** to infer what the ISM numbers imply for quarterly output growth, the ISM is indicative of a 2.0% quarterly decline in the fourth quarter, which is considerably steeper than the 0.3% drop in the official data.
The regressions also indicate that, with respective adjusted r-square values of 0.79 and 0.69, the IHS Markit index has exhibited a closer fit with the official data over the past decade than the ISM has.
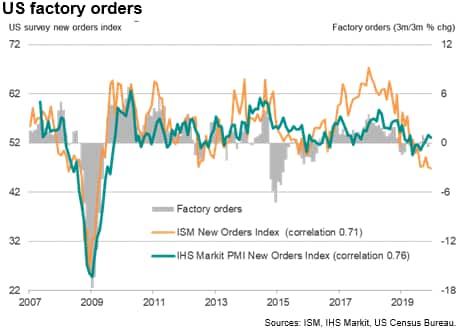
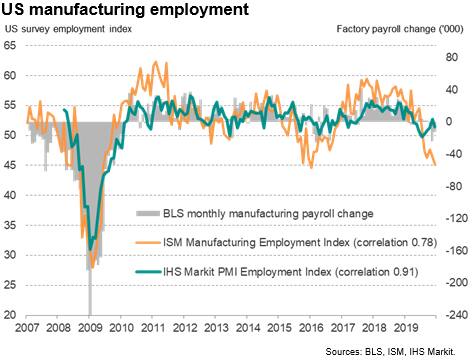
A similar divergence from official data has also been evident for the ISM survey against factory orders and employment numbers, a divergence which has not been seen in the IHS Markit data.
Survey differences
To help explain why the surveys differ we need to look closer at the methodologies:
- Survey panel sizes are different: IHS Markit's survey panel is larger than the ISM's stated panel size. IHS Markit surveys around 800 manufacturing companies (approximately double the size of the ISM panel size as stated on its website, which says it surveys "more than 300" companies) from which an 80% response rate is typically received. However, unlike IHS Markit, ISM does not disclose actual numbers of questionnaires received. As a general rule, a large panel size produces more stable and accurate survey results, meaning the data tend to be less volatile and 'noisy'.
- The surveys also use different panel structures: ISM data are based primarily on ISM members and other purchasing managers, and as such are likely to reflect business conditions in larger companies, with small- and medium-sized firms under-represented. In contrast, IHS Markit's survey includes a carefully structured mix of companies of all sizes, replicating official data showing the true composition of manufacturing output each year. IHS Markit also welcomes responses from other job titles outside of the purchasing profession, as many smaller firms will lack purchasing managers.
A consequence of it being biased towards larger, multinational firms is that the ISM data could be more heavily influenced by global conditions facing US-owned companies than the IHS Markit data. Note that global manufacturing growth outside of the US, as tracked by official production data, has matched the recent pattern of growth shown by the ISM, slowing sharply towards the end of 2019.
*Note that rather than compare the surveys with month-on-month changes in official data, which show considerable volatility, we compare the surveys with a rolling three-month rate of change in the official data (i.e. the change in output in the latest three months compared to the prior three months). This has the advantage of highlighting the growth trend in the official data while avoiding (a) the volatility of the monthly data and (b) the induced lag of annual growth rates.
**The regression of the ISM output index against the Federal Reserve manufacturing data over the same period as used of the IHS Markit regression yields an adjusted r-square of 0.69 and an equation of:
Output growth rate (3m/3m) = (ISM x 0.2103) - 11.7
Chris Williamson, Chief Business Economist, IHS
Markit
Tel: +44 207 260 2329
chris.williamson@ihsmarkit.com
© 2020, IHS Markit Inc. All rights reserved. Reproduction in whole or in part without permission is prohibited.
Purchasing Managers' Index™ (PMI™) data are compiled by IHS Markit for more than 40 economies worldwide. The monthly data are derived from surveys of senior executives at private sector companies, and are available only via subscription. The PMI dataset features a headline number, which indicates the overall health of an economy, and sub-indices, which provide insights into other key economic drivers such as GDP, inflation, exports, capacity utilization, employment and inventories. The PMI data are used by financial and corporate professionals to better understand where economies and markets are headed, and to uncover opportunities.
This article was published by S&P Global Market Intelligence and not by S&P Global Ratings, which is a separately managed division of S&P Global.
{"items" : [
{"name":"share","enabled":true,"desc":"<strong>Share</strong>","mobdesc":"Share","options":[ {"name":"facebook","url":"https://www.facebook.com/sharer.php?u=http%3a%2f%2fprod.azure.ihsmarkit.com%2fmarketintelligence%2fen%2fmi%2fresearch-analysis%2fus-manufacturing-sector-ends-2019-on-stronger-note-jan2020.html","enabled":true},{"name":"twitter","url":"https://twitter.com/intent/tweet?url=http%3a%2f%2fprod.azure.ihsmarkit.com%2fmarketintelligence%2fen%2fmi%2fresearch-analysis%2fus-manufacturing-sector-ends-2019-on-stronger-note-jan2020.html&text=US+manufacturing+sector+ends+2019+on+stronger+note%2c+in+line+with+S%26P+Global+PMI+signal+%7c+S%26P+Global+","enabled":true},{"name":"linkedin","url":"https://www.linkedin.com/sharing/share-offsite/?url=http%3a%2f%2fprod.azure.ihsmarkit.com%2fmarketintelligence%2fen%2fmi%2fresearch-analysis%2fus-manufacturing-sector-ends-2019-on-stronger-note-jan2020.html","enabled":true},{"name":"email","url":"?subject=US manufacturing sector ends 2019 on stronger note, in line with S&P Global PMI signal | S&P Global &body=http%3a%2f%2fprod.azure.ihsmarkit.com%2fmarketintelligence%2fen%2fmi%2fresearch-analysis%2fus-manufacturing-sector-ends-2019-on-stronger-note-jan2020.html","enabled":true},{"name":"whatsapp","url":"https://api.whatsapp.com/send?text=US+manufacturing+sector+ends+2019+on+stronger+note%2c+in+line+with+S%26P+Global+PMI+signal+%7c+S%26P+Global+ http%3a%2f%2fprod.azure.ihsmarkit.com%2fmarketintelligence%2fen%2fmi%2fresearch-analysis%2fus-manufacturing-sector-ends-2019-on-stronger-note-jan2020.html","enabled":true}]}, {"name":"rtt","enabled":true,"mobdesc":"Top"}
]}