Customer Logins
Obtain the data you need to make the most informed decisions by accessing our extensive portfolio of information, analytics, and expertise. Sign in to the product or service center of your choice.
Customer Logins
PUBLICATION
Oct 21, 2020
IHS Markit Fair Value Case Study: China Golden Week 2020
Fair Value Event: China Golden Week Exchange Holiday, October 2020
IHS Markit Fair Value in review
When market quotations are not readily available, such as when a foreign security's primary market is closed, many funds switch to fair value pricing. Using fair value pricing ensures that investors in the fund benefit from the most accurate share price possible. IHS Markit provides an independent fair value service that calculates the best estimate of stock and bond prices outside of active trading hours.
The following case study provides an analysis of fair value results for the China Golden Week stock exchange closure that spanned five days from October 1-8, 2020 and included several consecutive national holidays. In the absence of readily available quotes for Chinese securities during this holiday, IHS Markit provided fair value prices for Chinese securities to enable investors, primarily mutual funds with Chinese exposure, to more accurately calculate their net asset values (NAVs).
IHS Markit Fair Value results - 2020 Chinese Golden Week
Throughout the Chinese stock exchange holiday, IHS Markit continued to provide fair value prices, calculated using patent-pending multi-factor methodology, for 3600+ Chinese securities. The most common input factors in the IHS Markit Chinese fair valuation models included:
- Hang Seng Index Futures, S&P Futures
- iShares China Large-Cap ETF, Sector ETFs
- Chinese ADRs
Despite the Coronavirus refusing to ease its grip on most of the world, over 630 million Chinese traveled during the national holiday, spending tens of billions on goods and services. While the numbers were down from 2019, the magnitude of consumer spending was a positive sign for a Chinese economy ravaged by a global pandemic and continuing trade war with the United States.
In addition to the economic activity within China, major market indexes such as the S&P Index had steady upward trends throughout the holiday. And, unusually, Golden Week ended on a Thursday. Chinese markets reopened on Friday, October 9th. Fair Valuation is most difficult in Friday to Monday open situations, as there is far more time for significant market events to occur between valuation points.
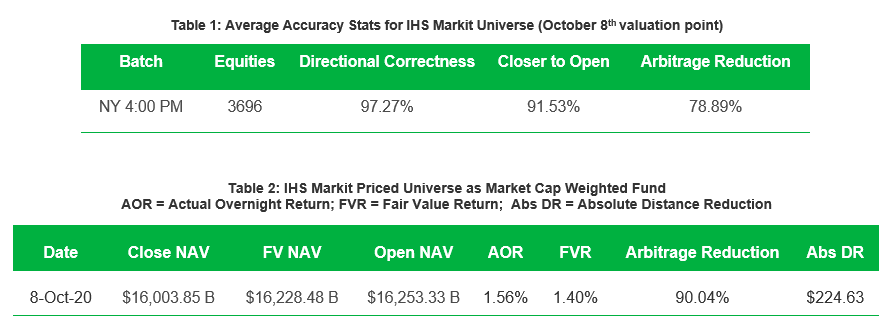
Consistent market movements and a business week reopening set the stage for highly accurate fair value performance. 3621 out of 3696 IHS Markit priced Chinese securities opened on October 9th. We were directionally across 3596 individual securities and closer to open across 3383. Potential arbitrage was reduced by 50% or more for 2286 securities. The two tables below showcase overall performance. Table 1 displays unweighted averages while table 2 aggregates IHS Markit's priced universe by market cap into a single fund.

Fair Value Modeling: Market Events and Human Bias
The classic approach to fair valuation is to use a proxy such as the S&P Futures and apply its return over a duration as the fair valuation adjustment for a group of securities. From that starting point, methods such as single variable regression modeling can increase the complexity of this process. Within single variable regression, look back periods determine the training data set, and different proxies can be used for different regions.
IHS Markit's multifactor stepwise regression model uses a yearlong look back period, specific global factor combinations for each country, approximately fifty sector factors assigned to one hundred and forty plus individual classifications, and thousands of ADRs to build custom models for tens of thousands of securities. Using detailed models in a completely automated process allows for consistent accuracy over long time horizons.
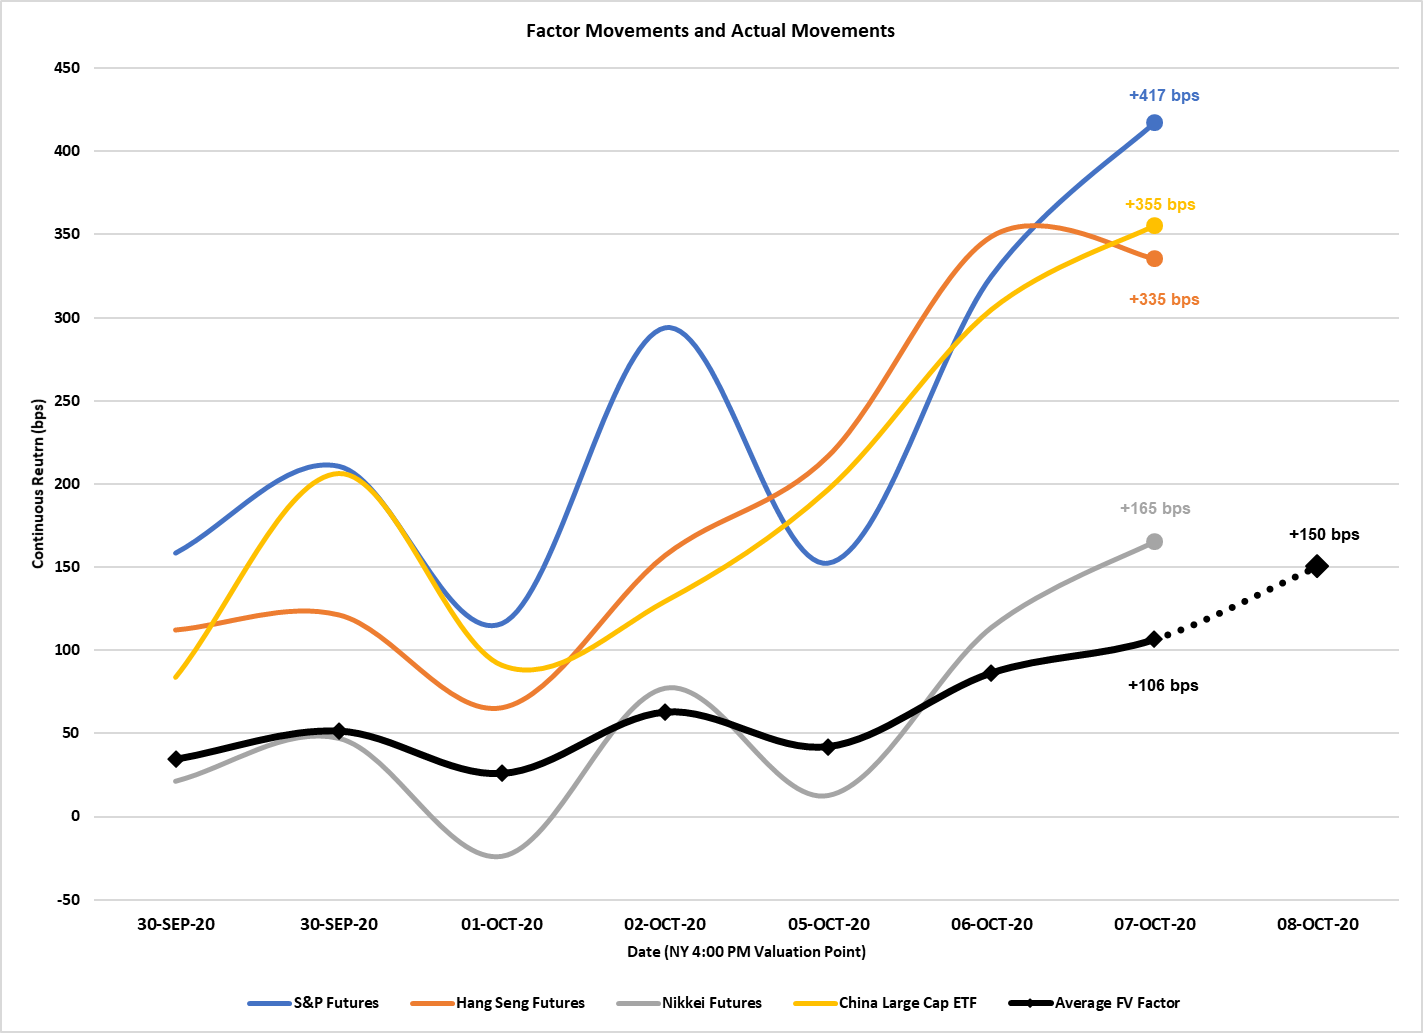
Often during holidays such as the Chinese Golden Week or times of market volatility, investors pay extremely close attention to major market indicators such as the four in the chart below. Fair valuations for relevant securities not in line with the observed movements of these indicators raises alarms.
As shown below, these four major Chinese proxies were trading significantly up from the September 30th Chinese market close through the October 8th US Market close. Any rational actor could assume that since the Hang Seng Futures and MSCI China Large Cap ETF were both trading up roughly 3.5% over the weeklong period, Chinese markets would open on the 9th somewhere in that range.
However, despite the market optimism outside of China, the average return over the holiday for Chinese securities was only 1.5%. A +3.5% fair valuation adjustment would significantly overvalue an investor's holdings, opening large arbitrage opportunities. The use of rigorously tested, detailed fair valuation methods prevents seemingly rational human observations from exposing portfolios to arbitrage.

Fair Value: Individual Large Cap Securities
As in the tables displaying overall performance, IHS Markit fair value captured movement with precision at the security level. Table three displays performance across various individual Chinese securities with large market capitalizations.

IHS Markit's Fair Value service helps clients meet their regulatory and compliance requirements by providing daily fair value adjustment factors and prices for over 150,000 equity and fixed income securities. We provide security-level as well as aggregate-level fair value adjustment factors across global hourly snaps with the ability to add custom snap times tailored to client requests. To learn more, please visit: ihsmarkit.com/products/pricing-data-fair-value.html or contact: MK-FixedIncomePricingBusinessDevelopment@ihsmarkit.com
Appendix
Actual Overnight Return: The return of a security from its last close to its next open, regardless of how long the time gap may be.
Directional Correctness: occurs when a fair value price is in the same direction (+, -) as the actual overnight return of the underlying security. The values present in the document are the proportion of securities within a group that were directionally correct.
Closer to Open: whether a fair value price is closer to the next day open than the previous close. The values present in the document are the proportion of securities within a group that were closer to open.
Arbitrage Reduction: the amount of the movement in the underlying security that we captured using our Fair Value price. These values can be positive or negative, with 100% being full capture. For tables 1 and 2, the values are the average arbitrage reduction across the group.
Market Cap Calculations: To represent components of an index we use shares outstanding multiplied by either the close, fair value, or open price of a security. The result of this is an individual security's market cap at a given time. The sum of the securities' market caps within each index gives the total market cap at a given time. Domestic currencies are used for all calculations.
{"items" : [
{"name":"share","enabled":true,"desc":"<strong>Share</strong>","mobdesc":"Share","options":[ {"name":"facebook","url":"https://www.facebook.com/sharer.php?u=http%3a%2f%2fprod.azure.ihsmarkit.com%2fmarketintelligence%2fen%2fmi%2fresearch-analysis%2fihs-markit-fair-value-case-study-china-golden-week-2020.html","enabled":true},{"name":"twitter","url":"https://twitter.com/intent/tweet?url=http%3a%2f%2fprod.azure.ihsmarkit.com%2fmarketintelligence%2fen%2fmi%2fresearch-analysis%2fihs-markit-fair-value-case-study-china-golden-week-2020.html&text=S%26P+Global+Fair+Value+Case+Study%3a+China+Golden+Week+2020+%7c+S%26P+Global+","enabled":true},{"name":"linkedin","url":"https://www.linkedin.com/sharing/share-offsite/?url=http%3a%2f%2fprod.azure.ihsmarkit.com%2fmarketintelligence%2fen%2fmi%2fresearch-analysis%2fihs-markit-fair-value-case-study-china-golden-week-2020.html","enabled":true},{"name":"email","url":"?subject=S&P Global Fair Value Case Study: China Golden Week 2020 | S&P Global &body=http%3a%2f%2fprod.azure.ihsmarkit.com%2fmarketintelligence%2fen%2fmi%2fresearch-analysis%2fihs-markit-fair-value-case-study-china-golden-week-2020.html","enabled":true},{"name":"whatsapp","url":"https://api.whatsapp.com/send?text=S%26P+Global+Fair+Value+Case+Study%3a+China+Golden+Week+2020+%7c+S%26P+Global+ http%3a%2f%2fprod.azure.ihsmarkit.com%2fmarketintelligence%2fen%2fmi%2fresearch-analysis%2fihs-markit-fair-value-case-study-china-golden-week-2020.html","enabled":true}]}, {"name":"rtt","enabled":true,"mobdesc":"Top"}
]}


