Customer Logins
Obtain the data you need to make the most informed decisions by accessing our extensive portfolio of information, analytics, and expertise. Sign in to the product or service center of your choice.
Customer Logins
ECONOMICS COMMENTARY
May 30, 2025
How to interpret and use the PMI Capacity Utilisation Index

Please click here for the full report
The PMI Capacity Utilisation Index from S&P Global Market Intelligence is a metric derived using monthly backlogs of work and suppliers' delivery times data from our renowned Purchasing Managers' Index surveys. Signalling the extent to which current productive capacity and supply chains are being employed relative to demand, the measure provides insights into future growth and inflationary trends.
What does the Capacity Utilisation Index measure?
Capacity utilisation measures the extent to which productive capacity is employed to produce output. Closely linked to short-term developments in demand, economists follow capacity utilisation trends for their ability to provide advance inflationary signals and insights into the health of the economy.
The derived PMI capacity utilisation series is based on monthly PMI survey responses related to manufacturers backlogs of work and suppliers' delivery times, compiled by S&P Global Market Intelligence.
How is the PMI Capacity Utilisation Index compiled?
The PMI Capacity Utilisation Index is derived using company-level data from representative national manufacturing sector survey panels. Companies are asked the following questions on their backlogs of work and suppliers' delivery times:
Please compare the volume of backlogs of work (in units) this month with the situation one month ago.
Please compare supplier delivery times for inputs this month with the situation one month ago.
The index is then calculated using a weighted combination of the resulting backlogs and suppliers' delivery times series. The latter is inverted in the calculation such that longer delivery times - i.e. more delays - are consistent with accumulating backlogs of work, and that faster delivery times - i.e. fewer delays - are consistent with fewer backlogs of work. When interpreting the Capacity Utilisation Index, higher values indicate that firms are working closer to their maximum capacity and vice versa.
Why does capacity utilisation matter?
Capacity utilisation is the extent to which the productive capability of a firm is being used, where the optimal rate will maximise efficiency while minimising costs. Understanding capacity utilisation trends can help to detect inefficiencies and provide business performance and financial health insights. At the national level, the difference between actual and potential output is typically known as the output gap - an extremely important concept in macroeconomic theory.
Whether an economy is operating at full capacity has important implications for inflation. High capacity utilisation generally puts upward pressure on prices and is when its relationship with inflation is strongest. In the short-run, manufacturers will utilise labour and capital to a greater intensity to satisfy an increase in demand. Periods of raised capacity pressure are generally temporary and at this time responding to additional demand can be costly, due to increased labour costs (for example, paying workers overtime) and greater costs to linked to increased capital usage through effects such as maintenance and depreciation. As well as passing through increased costs to customers, stronger demand conditions at times of strained capacity may also encourage firms to be more aggressive in their price setting.
Eventually, companies generally will make capital and labour investment decisions following a sustained period of strained capacity, raising capital expenditure and hiring staff accordingly.
In contrast, a low rate of capacity utilisation infers the underuse of resources, known as capacity slack. Contributing factors include subdued demand or limited input supply (the latter perhaps linked to cashflow issues or supply chain inefficiencies). A sustained period of excess capacity utilisation can lead to reduced staffing needs, and acts as a deterrent for internal and external investment. As such, excess capacity is typically a sign of general economic weakness.
Furthermore, a firm's ability to raise efficiency while limiting costs has important implications for profitability. Manufacturers incur fixed costs, those independent of production volumes, and variable costs, those per unit of output. With a lower rate of capacity utilisation, fixed costs are spread across fewer units produced, again reducing profitability.
How accurate is the PMI Capacity Utilisation Index?
As capacity utilisation is difficult to measure, there exists a wide variety of data collection methodologies. One example includes collecting self-reported survey data from a sample of companies to provide capacity utilisation insights. This however relies on the assumption that manufacturers are able to understand their maximum capacity and accurately report their rate of capacity utilisation. Measurement can be challenging due to a number of external influencing factors, for example, economic conditions and supply chain disruption. The definition of 'full capacity' can also be difficult to accurately measure. For example, a factory may be able to add another shift to extend its 'normal' operating capacity. A restaurant may be able to add more tables to its floor area.
The PMI Capacity Utilisation Index is an indirectly derived index which helps to address some of these challenges by using backlogs of work and suppliers' delivery times (inverted) indices. This concept works to identify whether manufacturers and their suppliers are struggling to cope with their current workloads irrespective of issues such as variations to its operating capacity limits. Rising backlogs of works suggests that companies are working at or close to their full capacity. Meanwhile, longer delivery times on inputs signal suppliers' inability to meet orders in a timely manner, therefore implying greater resource strain.
In addition, the PMI Capacity Utilisation Index is also advantageous as it is derived from timely survey findings, often made available both earlier than official data and at a greater frequency. An additional benefit of the PMI series is that official capacity utilisation data are simply not available for many economies.
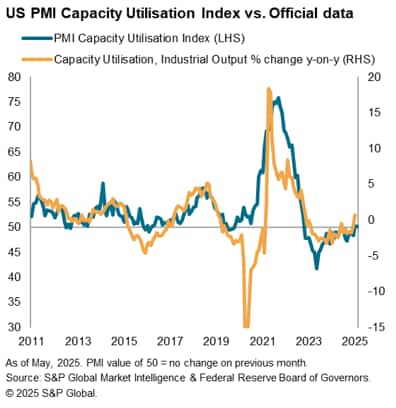
Figure 1. depicts a close relationship between the PMI Capacity Utilisation Index and comparable official US data. Particularly amid unprecedented pandemic trends and supply chain disruption, there is some deviation between the PMI-based index and official data due to differences in methodology. The official data series aims to capture capacity utilisation trends of the firm assuming sufficient availability of inputs, while the PMI series incorporates pressure on suppliers and supply chains to provide a more holistic estimate of firms' production capabilities. This was especially important during the pandemic, when shutdowns of varying degrees impacted global supply chains and input availability.
Figure 1.
A further feature of the PMI series is the ability to explain movements using anecdotal evidence provided by survey panellists through the Global PMI Panel Comments Tracker (PCT) database. This complementary tool tracks the frequency of words or phrases relating to strained capacity utilisation mentioned in qualitative replies.
Figure 2.
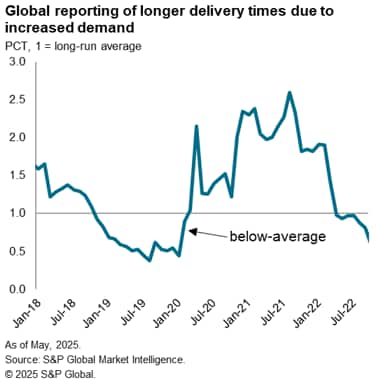
During the pandemic subdued demand led to a drop in backlogs of work, while factory shutdowns and input shortages caused longer delivery times. Lead times lengthened due to unexpected, non-capacity related reasons, meaning the assumption that longer delivery times signal increased pressure on vendors was not wholly satisfied. We can use PCT data in conjunction with the PMI Capacity Utilisation Index to help to determine circumstances when this is the case. Figure 2. shows that during the early stages of the pandemic, those respondents attributing longer delivery times to increased demand was indeed below its long-run average (since 2005).
How can the Capacity Utilisation Index be used?
Advance inflation signals
Capacity utilisation is highly cyclical and positively correlated with future inflation due its close relationship with the imbalance of demand relative to supply i.e. higher inflation rates will usually follow higher rates of capacity utilisation.
Working closer to maximum capacity is likely to have cost implications e.g. increased staff costs due to over time, increased input prices and maintenance costs for capital, which are likely to be passed on to the customer. Meanwhile, a lower rate of capacity utilisation signals a combination of excess capacity and lack of demand, leading to a drop in prices as firms offer discounts to stimulate higher sales volumes. As this response is lagged, the PMI Capacity Utilisation Index therefore has forward looking properties.
Figure 3.
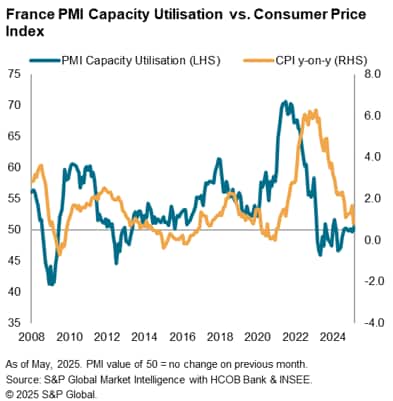
Figure 3. shows this relationship in France, where the Capacity Utilisation PMI can be seen to lead the Consumer Price Index (CPI). Its ability to provide advance inflationary signals make it valuable to stakeholders that follow price trends, namely central banks, investors, businesses, and researchers.
Corporate earnings insights
Given that the PMI surveys are private sector focused, the data perform well in indicating changes in corporate performance. The impact on capacity utilisation is two-fold.
First, given that a higher rate of capacity utilisation implies greater demand, it therefore allows firms more pricing power and means profitability can be boosted, at least in the short run. Second, at the company level, working closer to maximum potential output is often a sign of lower unit costs, with fixed costs spread over a greater number of units.
High capacity utilisation can also influence longer term decisions, as manufacturers are likely to expand capacity, through investment in capital and labour, following a sustained period of capacity pressure.
Figure 4.
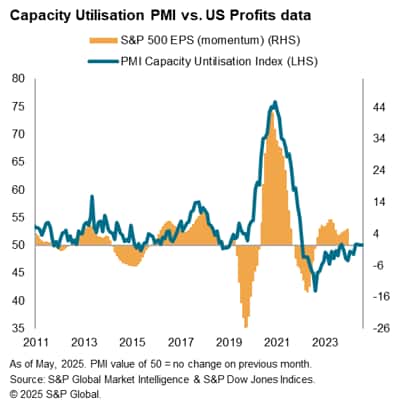
Figure 4. highlights this relationship, as the US PMI Capacity Utilisation Index is seen to closely track S&P500 Earnings Per Share (momentum) data.
Indicator for future growth, production, and employment
The rate of capacity utilisation can influence production volumes and employment decisions. The relationship with the former is in the short-term: assuming productivity levels are constant, greater capacity utilisation leads to higher output and growth. Meanwhile, firms are slower to respond in their employment decisions. This trend is confirmed in figure 5, where the Employment PMI is seen to lag both the PMI Capacity Utilisation and Output Indices.
Figure 5.
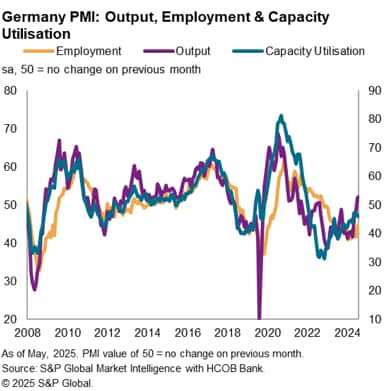
This relationship confirms that the PMI Capacity Utilisation index can provide advanced signals for firms' future investment, as those working at a higher rate of capacity utilisation are likely to look towards expansion.
Summary
The PMI Capacity Utilisation Index is a derived indicator that complements S&P Global's country level and regional PMI datasets. As shown above, the Capacity Utilisation Index can be applied to a wide variety of use cases, with value in part stemming from its timely nature and monthly frequency. The Capacity Utilisation Index is useful to a number of stakeholders given its forward-looking properties surrounding inflation, as well as its close relationship with growth and company profits.
What are the advantages of the PMI series?
The PMI series provide an advance signal of what is happening in the private sector economy and are advantageous for the following reasons:
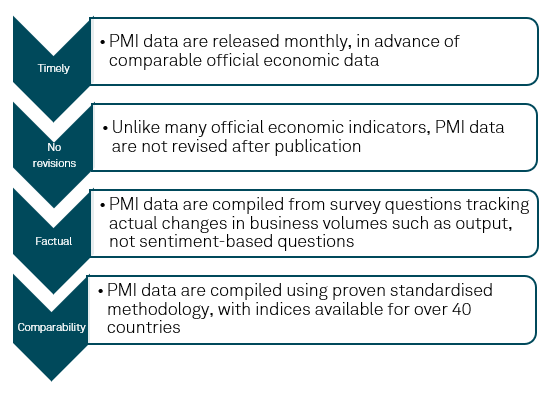
As data are collected mid-month and released at the start of the following reference period, they are often available well-ahead of official statistics and are not revised after publication. Panels are constructed to represent the manufacturing economy, and the survey questions are designed to track actual changes in variables (not sentiment-based). At present, the PMI Capacity Utilisation Index is published for the following economies:
Austria, Brazil, Czech Republic, European Union, Eurozone, France, Germany, Global, Greece, Hong Kong SAR, India, Ireland, Italy, Japan, Mainland China, the Netherlands, Poland, Russia, Spain, South Korea, Taiwan, Turkey, and the UK.
Eleanor Dennison, Economist, S&P Global Market Intelligence
Tel: +44 1344 328 197
Email: eleanor.dennison@spglobal.com
© 2025, S&P Global. All rights reserved. Reproduction in whole
or in part without permission is prohibited.
Purchasing Managers' Index™ (PMI®) data are compiled by S&P Global for more than 40 economies worldwide. The monthly data are derived from surveys of senior executives at private sector companies, and are available only via subscription. The PMI dataset features a headline number, which indicates the overall health of an economy, and sub-indices, which provide insights into other key economic drivers such as GDP, inflation, exports, capacity utilization, employment and inventories. The PMI data are used by financial and corporate professionals to better understand where economies and markets are headed, and to uncover opportunities.
This article was published by S&P Global Market Intelligence and not by S&P Global Ratings, which is a separately managed division of S&P Global.
{"items" : [
{"name":"share","enabled":true,"desc":"<strong>Share</strong>","mobdesc":"Share","options":[ {"name":"facebook","url":"https://www.facebook.com/sharer.php?u=http%3a%2f%2fprod.azure.ihsmarkit.com%2fmarketintelligence%2fen%2fmi%2fresearch-analysis%2fhow-to-interpret-and-use-the-pmi-capacity-utilisation-index-May25.html","enabled":true},{"name":"twitter","url":"https://twitter.com/intent/tweet?url=http%3a%2f%2fprod.azure.ihsmarkit.com%2fmarketintelligence%2fen%2fmi%2fresearch-analysis%2fhow-to-interpret-and-use-the-pmi-capacity-utilisation-index-May25.html&text=How+to+interpret+and+use+the+PMI+Capacity+Utilisation+Index+%7c+S%26P+Global+","enabled":true},{"name":"linkedin","url":"https://www.linkedin.com/sharing/share-offsite/?url=http%3a%2f%2fprod.azure.ihsmarkit.com%2fmarketintelligence%2fen%2fmi%2fresearch-analysis%2fhow-to-interpret-and-use-the-pmi-capacity-utilisation-index-May25.html","enabled":true},{"name":"email","url":"?subject=How to interpret and use the PMI Capacity Utilisation Index | S&P Global &body=http%3a%2f%2fprod.azure.ihsmarkit.com%2fmarketintelligence%2fen%2fmi%2fresearch-analysis%2fhow-to-interpret-and-use-the-pmi-capacity-utilisation-index-May25.html","enabled":true},{"name":"whatsapp","url":"https://api.whatsapp.com/send?text=How+to+interpret+and+use+the+PMI+Capacity+Utilisation+Index+%7c+S%26P+Global+ http%3a%2f%2fprod.azure.ihsmarkit.com%2fmarketintelligence%2fen%2fmi%2fresearch-analysis%2fhow-to-interpret-and-use-the-pmi-capacity-utilisation-index-May25.html","enabled":true}]}, {"name":"rtt","enabled":true,"mobdesc":"Top"}
]}