Customer Logins
Obtain the data you need to make the most informed decisions by accessing our extensive portfolio of information, analytics, and expertise. Sign in to the product or service center of your choice.
Customer Logins
ECONOMICS COMMENTARY
Aug 10, 2020
Commodity prices rise across the board in July

- Copper lead gains in metal prices
- Energy prices rise, but remain historically low
- Chemicals up 6% as shortages ease
All monitored commodities saw solid price gains during July as global demand strengthened and supply chains began to recover from coronavirus disease 2019 (COVID-19) related restrictions. That said, most prices remained below pre-COVID levels, with copper and iron ore the notable exceptions. Transport costs meanwhile soared amid further travel delays and a partial rebound in global trade volumes.
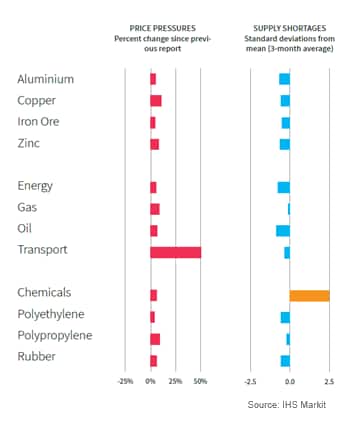
The latest Price & Supply Monitor - a monthly report designed to track global commodity price pressures and supply shortages - saw all 12 monitored commodity indices rise in price since June.
The IHS Markit Price & Supply Monitor is derived from IHS Markit Pricing & Purchasing data and the Purchasing Managers' Index™ (PMI) business surveys. PMI survey respondents are invited to itemise specific goods where supply shortages have developed. This information is transformed into indicators which show the development of supply pressures relative to long-run trends.
Transport costs saw by far the largest price gain of 50% as shipment demand improved and some travel restrictions remained in place. Copper saw the next-largest increase, up 11% due to stronger demand and mine stoppages. Polypropylene followed with a 9% gain. While polyethylene saw the smallest uptick of the 12 indices, it still climbed 4% from June to the highest in five months.
Supply shortages remained low across most of the monitored commodities, with chemicals again the exception. That said, reports from global panellists of chemical shortages fell back from May's record high.
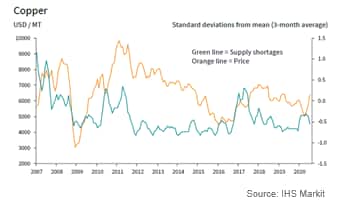
Copper leads gains in metal prices
Metal prices continued their upward trajectory at the start of the second half of the year. All four monitored metals rose in price, led by copper which increased nearly 11% to the highest monthly average since April 2019. The mark-up was reportedly due to mine stoppages in South America, rising global demand and reduced inventories. However, reports from panellists of supply shortages were lower than in June.
Zinc was the second-biggest mover in July, rising 8% to a six-month high. Aluminium rounded off the non-ferrous grouping with a 5% price increase. Nevertheless, both metals remained below their 24-month averages.
Iron ore prices rose for the third month running in July, up 5% to $107/DMTU, the highest seen for a year. The increase was partly linked to greater Chinese stimulus in the construction sector. Meanwhile, concerns of supply shortages weakened since June.
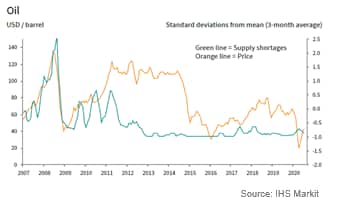
Energy prices rise, but remain historically low
The IHS Markit Energy Prices Index climbed a further 6% in July to recover more ground lost during the COVID-19 pandemic. The index was at its highest in four months, but remained well down on the level seen at the start of 2020.
Oil and gas both recorded solid gains at the start of the third quarter. Gas prices rose 8% to erase the losses from June, while oil climbed 7% to $43/barrel, its highest price since February. These upticks were largely attributed to rising global demand and increased vehicle mobility. Panellists noted that availability of both commodities remained strong.
Meanwhile, a return to more normal activity and an increase in bulk shipping demand led to a marked rise in transport costs in July. The index rose 50% to the highest for seven months, and was above its two-year average.
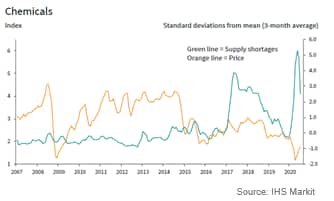
Chemicals up 6% as shortages ease
Chemical prices continued to recover in July from their collapse earlier this year. The IHS Markit Chemical Prices Index rose 6% during the month, leading to an overall 51% increase from April's 18-year low. The latest mark-up was largely due to a rebound in global demand following the economic impact of the COVID-19 pandemic.
All three monitored commodities rose for the third successive month, led by polypropylene which increased by 9%. Rubber prices climbed 6%, while polyethylene saw the smallest uptick of just 4%. Only rubber was in line with its 24-month average; both polypropylene and polyethylene prices remained relatively weak.
At the same time, panel mentions of chemical shortages continued to decrease in July, having reached a record high in May. That said, supply concerns were still relatively strong as some countries kept lockdown restrictions in place.
David Owen, Economist, IHS Markit
Tel: +44 2070 646 237
david.owen@ihsmarkit.com
© 2020, IHS Markit Inc. All rights reserved. Reproduction in whole or in part without permission is prohibited.
Purchasing Managers' Index™ (PMI™) data are compiled by IHS Markit for more than 40 economies worldwide. The monthly data are derived from surveys of senior executives at private sector companies, and are available only via subscription. The PMI dataset features a headline number, which indicates the overall health of an economy, and sub-indices, which provide insights into other key economic drivers such as GDP, inflation, exports, capacity utilization, employment and inventories. The PMI data are used by financial and corporate professionals to better understand where economies and markets are headed, and to uncover opportunities.
This article was published by S&P Global Market Intelligence and not by S&P Global Ratings, which is a separately managed division of S&P Global.
{"items" : [
{"name":"share","enabled":true,"desc":"<strong>Share</strong>","mobdesc":"Share","options":[ {"name":"facebook","url":"https://www.facebook.com/sharer.php?u=http%3a%2f%2fprod.azure.ihsmarkit.com%2fmarketintelligence%2fen%2fmi%2fresearch-analysis%2fcommodity-prices-rise-across-the-board-in-july-August2020.html","enabled":true},{"name":"twitter","url":"https://twitter.com/intent/tweet?url=http%3a%2f%2fprod.azure.ihsmarkit.com%2fmarketintelligence%2fen%2fmi%2fresearch-analysis%2fcommodity-prices-rise-across-the-board-in-july-August2020.html&text=Commodity+prices+rise+across+the+board+in+July+%7c+S%26P+Global+","enabled":true},{"name":"linkedin","url":"https://www.linkedin.com/sharing/share-offsite/?url=http%3a%2f%2fprod.azure.ihsmarkit.com%2fmarketintelligence%2fen%2fmi%2fresearch-analysis%2fcommodity-prices-rise-across-the-board-in-july-August2020.html","enabled":true},{"name":"email","url":"?subject=Commodity prices rise across the board in July | S&P Global &body=http%3a%2f%2fprod.azure.ihsmarkit.com%2fmarketintelligence%2fen%2fmi%2fresearch-analysis%2fcommodity-prices-rise-across-the-board-in-july-August2020.html","enabled":true},{"name":"whatsapp","url":"https://api.whatsapp.com/send?text=Commodity+prices+rise+across+the+board+in+July+%7c+S%26P+Global+ http%3a%2f%2fprod.azure.ihsmarkit.com%2fmarketintelligence%2fen%2fmi%2fresearch-analysis%2fcommodity-prices-rise-across-the-board-in-july-August2020.html","enabled":true}]}, {"name":"rtt","enabled":true,"mobdesc":"Top"}
]}