
Comprehensive assessments and data sets for vehicle use phase and car manufacturers' Scope 3 Category 11 carbon emissions
Decarbonization is a competitive factor for the automotive industry. Emissions that occur after a vehicle is sold (Scope 3 Category 11 – also known as the use phase) currently makes up about 70-80% of a automaker's carbon profile and potentially more for auto suppliers. Reducing the use phase carbon footprint is a primary goal for major automakers. Missing those goals, particularly in an environment where regulatory requirements are growing more stringent, is a huge financial risk.
Reliable and consistent carbon accounting information is a key asset highly demanded by automotive stakeholders to support their decarbonization journey. S&P Global Mobility offers datasets in a consistent and comparable format to enable benchmarking, target tracking, competitive analysis, and self-reporting.
Automotive Carbon Accounting Benefits
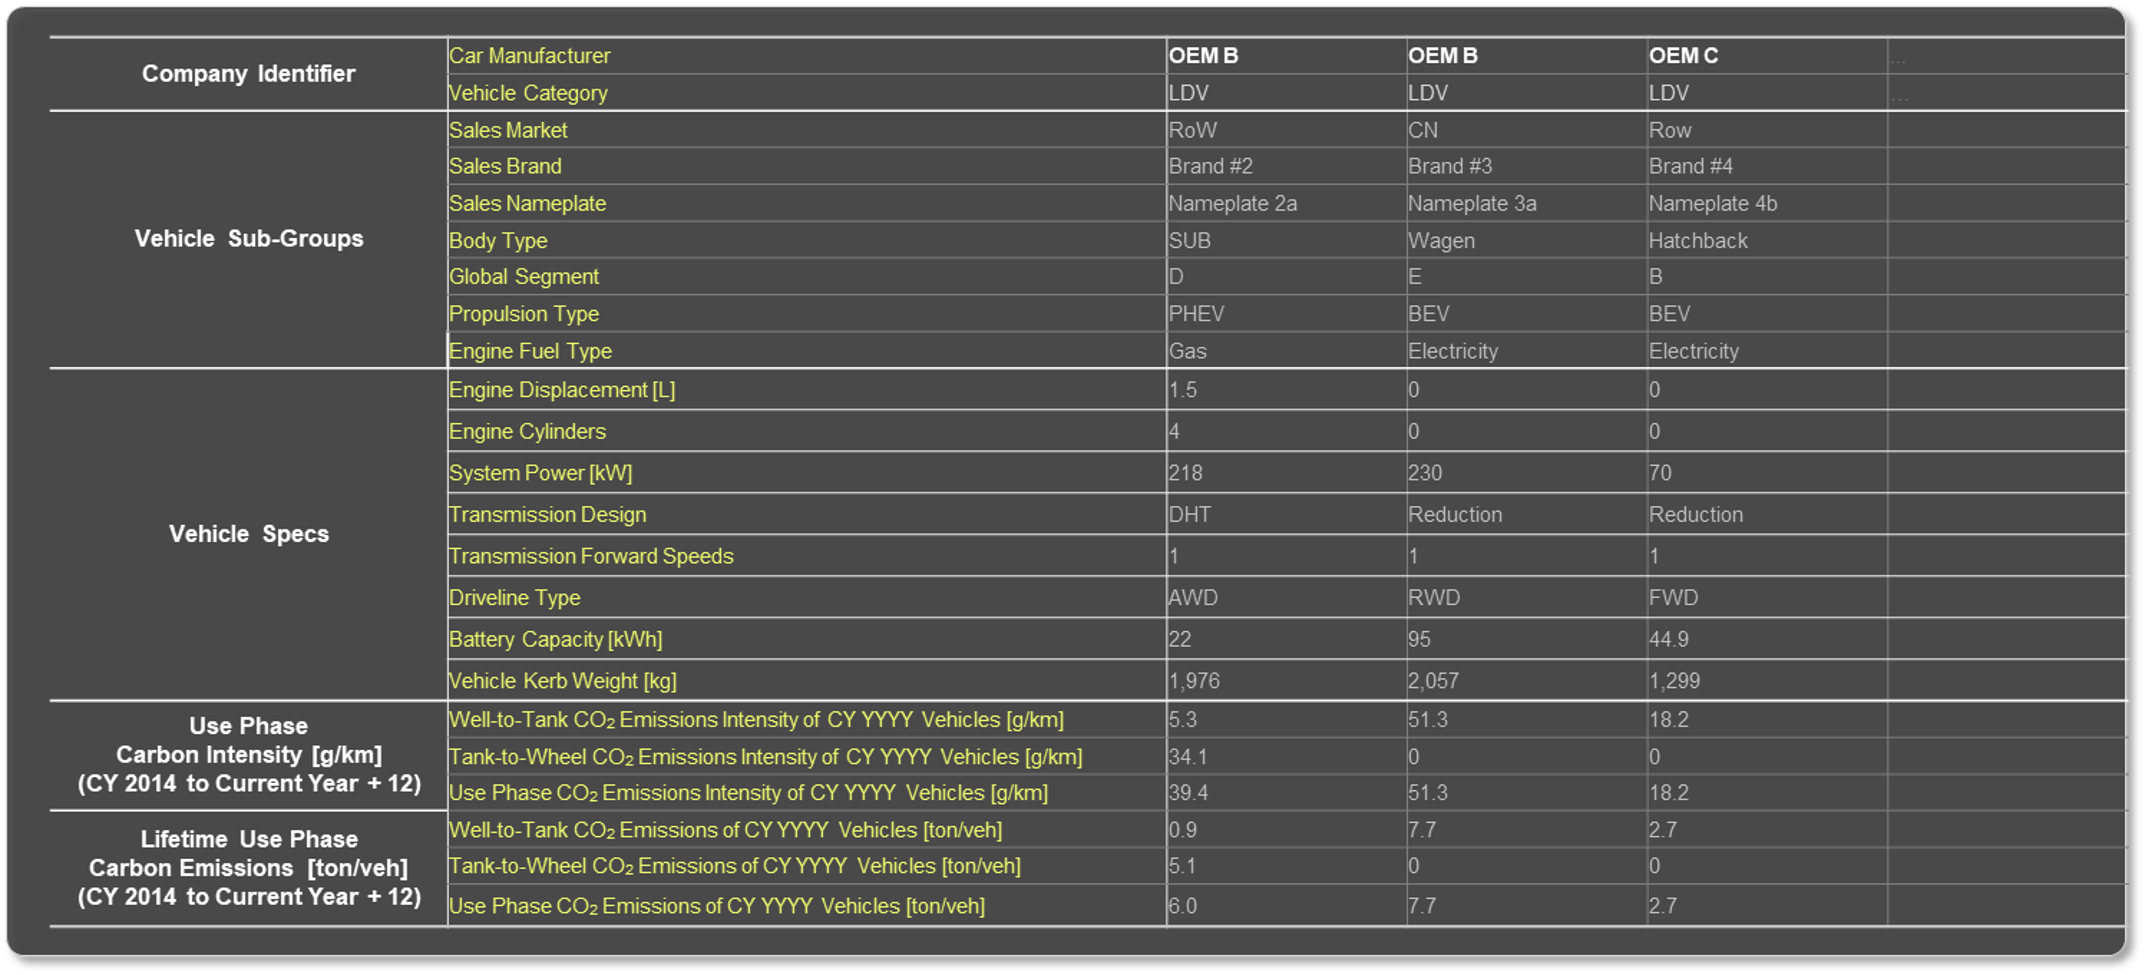
Our Carbon Accounting Downstream solution offers comprehensive datasets of global car manufacturers' and vehicle models’ lifecycle carbon emissions including use-phase, well-to-wheel emissions (or Scope 3 Category 11).
The database allows the automotive stakeholders to:
- Self-report on carbon accounting
- Set industry benchmarks around carbon emissions reduction targets
- Track industry/corporate decarbonization target fulfilment
- Plan for competitive strategies to achieve carbon reduction goals
- Make supply chain or investment decisions to improve decarbonization efforts
- Use reliable data sources and a consistent methodology
Compare and contrast well-to-wheel CO2 emissions
Download data samples for carbon accounting
Who benefits from our Automotive Carbon Accounting Downstream dataset?

Financial Institutions
- Understand overall automotive technology trends and their impacts on use-phase decarbonization
- Identify industry benchmarks and best practices, and set decarbonization targets
- Report Scope 3 financed emissions with more reliable data built upon a granular and consistent source and methodology

OEMs
- Understand industry and competitors use-phase carbon portfolios
- Track target alignments and identify potential regulatory/transitional risks
- Make informed decisions on product roadmaps regionally and globally to stay on track with decarbonization targets and competitiveness

Auto Suppliers
- Understand automaker's use-phase decarbonization trends driven by technology developments
- Stay informed and prepared for product management under the dynamics of clients’ technological changes and market regulations
- Report allocated Scope 3 use-phase carbon emissions and make decarbonization strategies using reliable and granular vehicle use-phase carbon footprint data

How much carbon is hidden in your investment portfolios?
Webinar | 1 August 2024
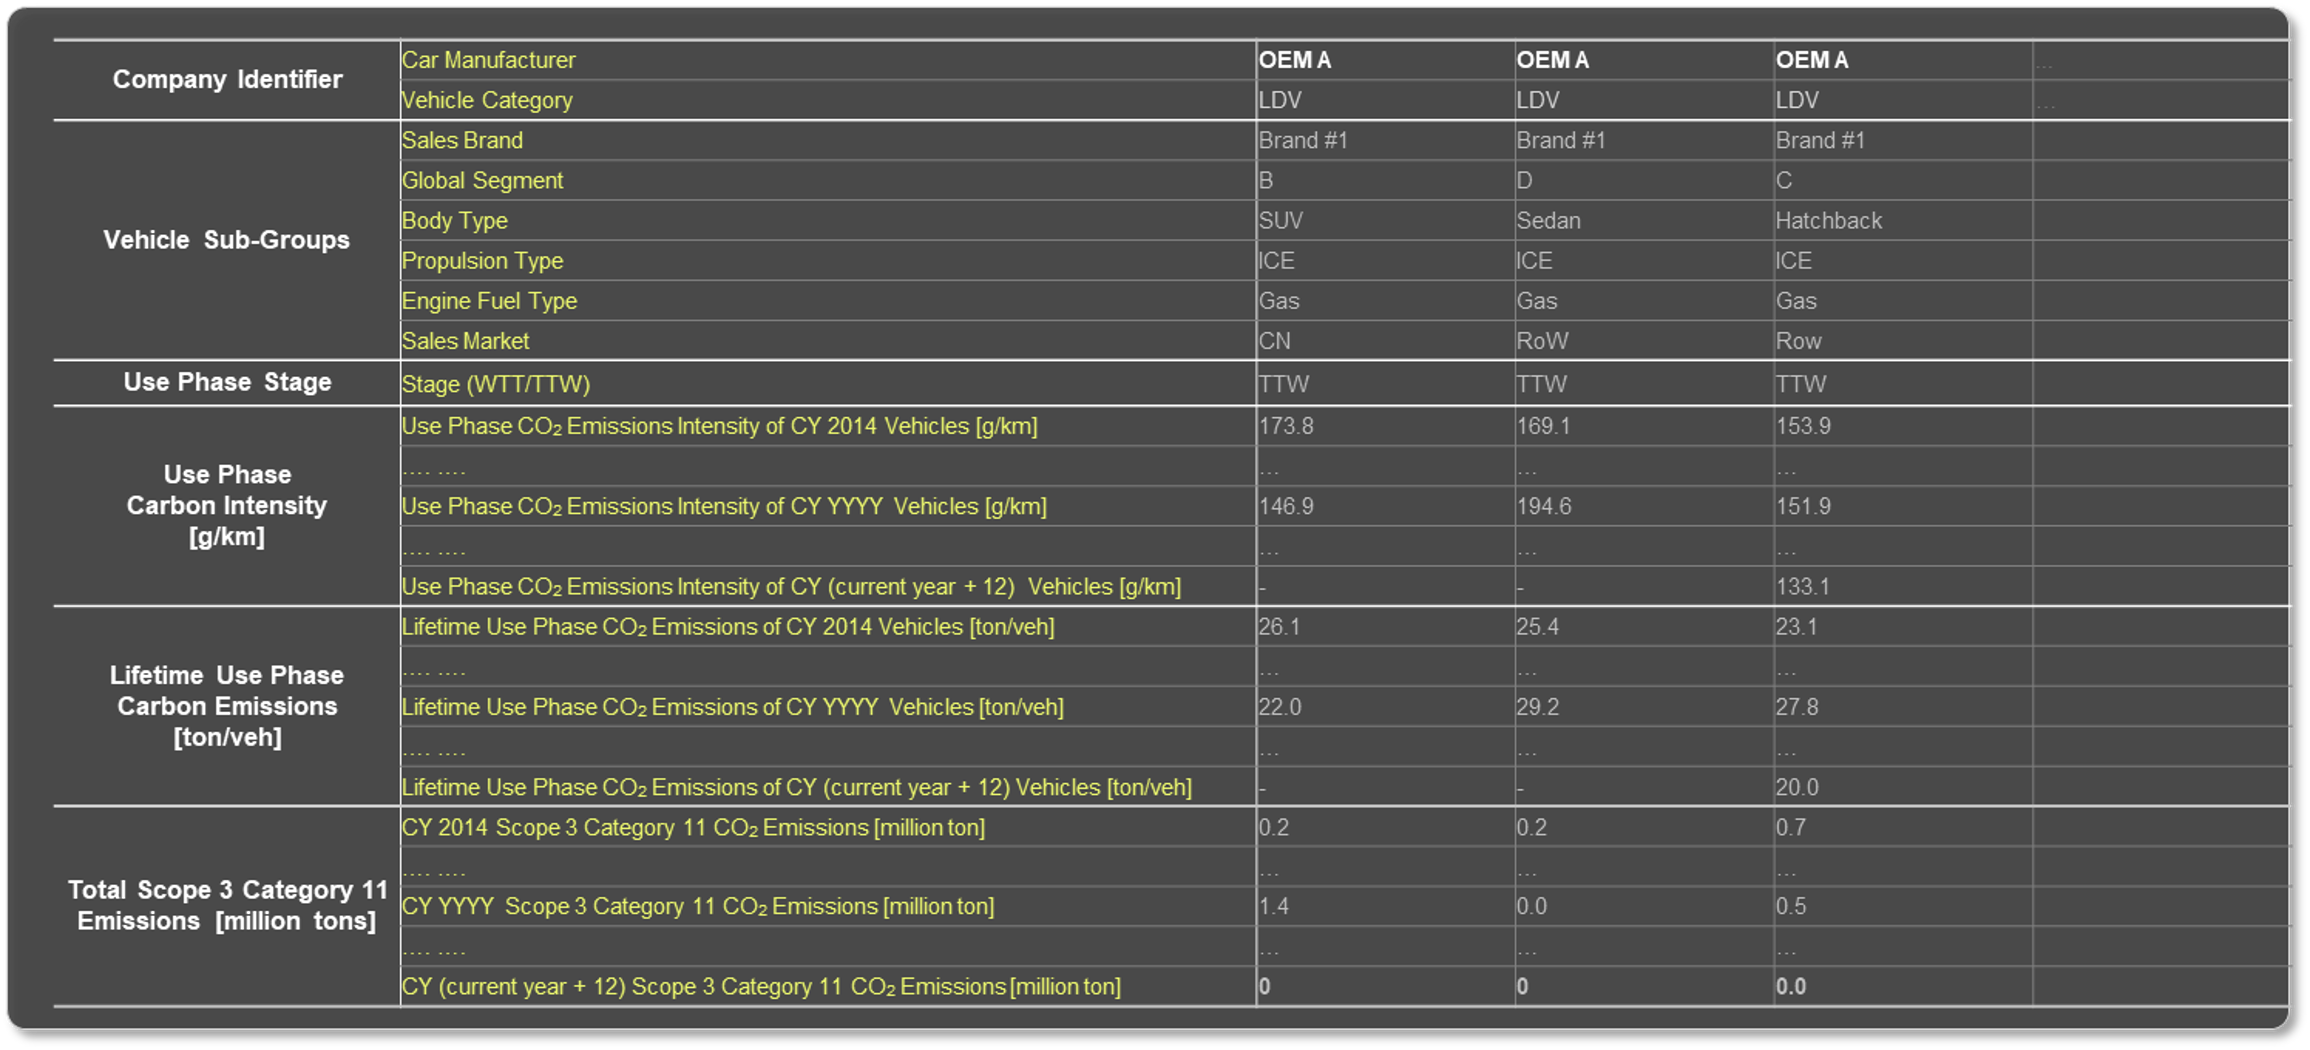
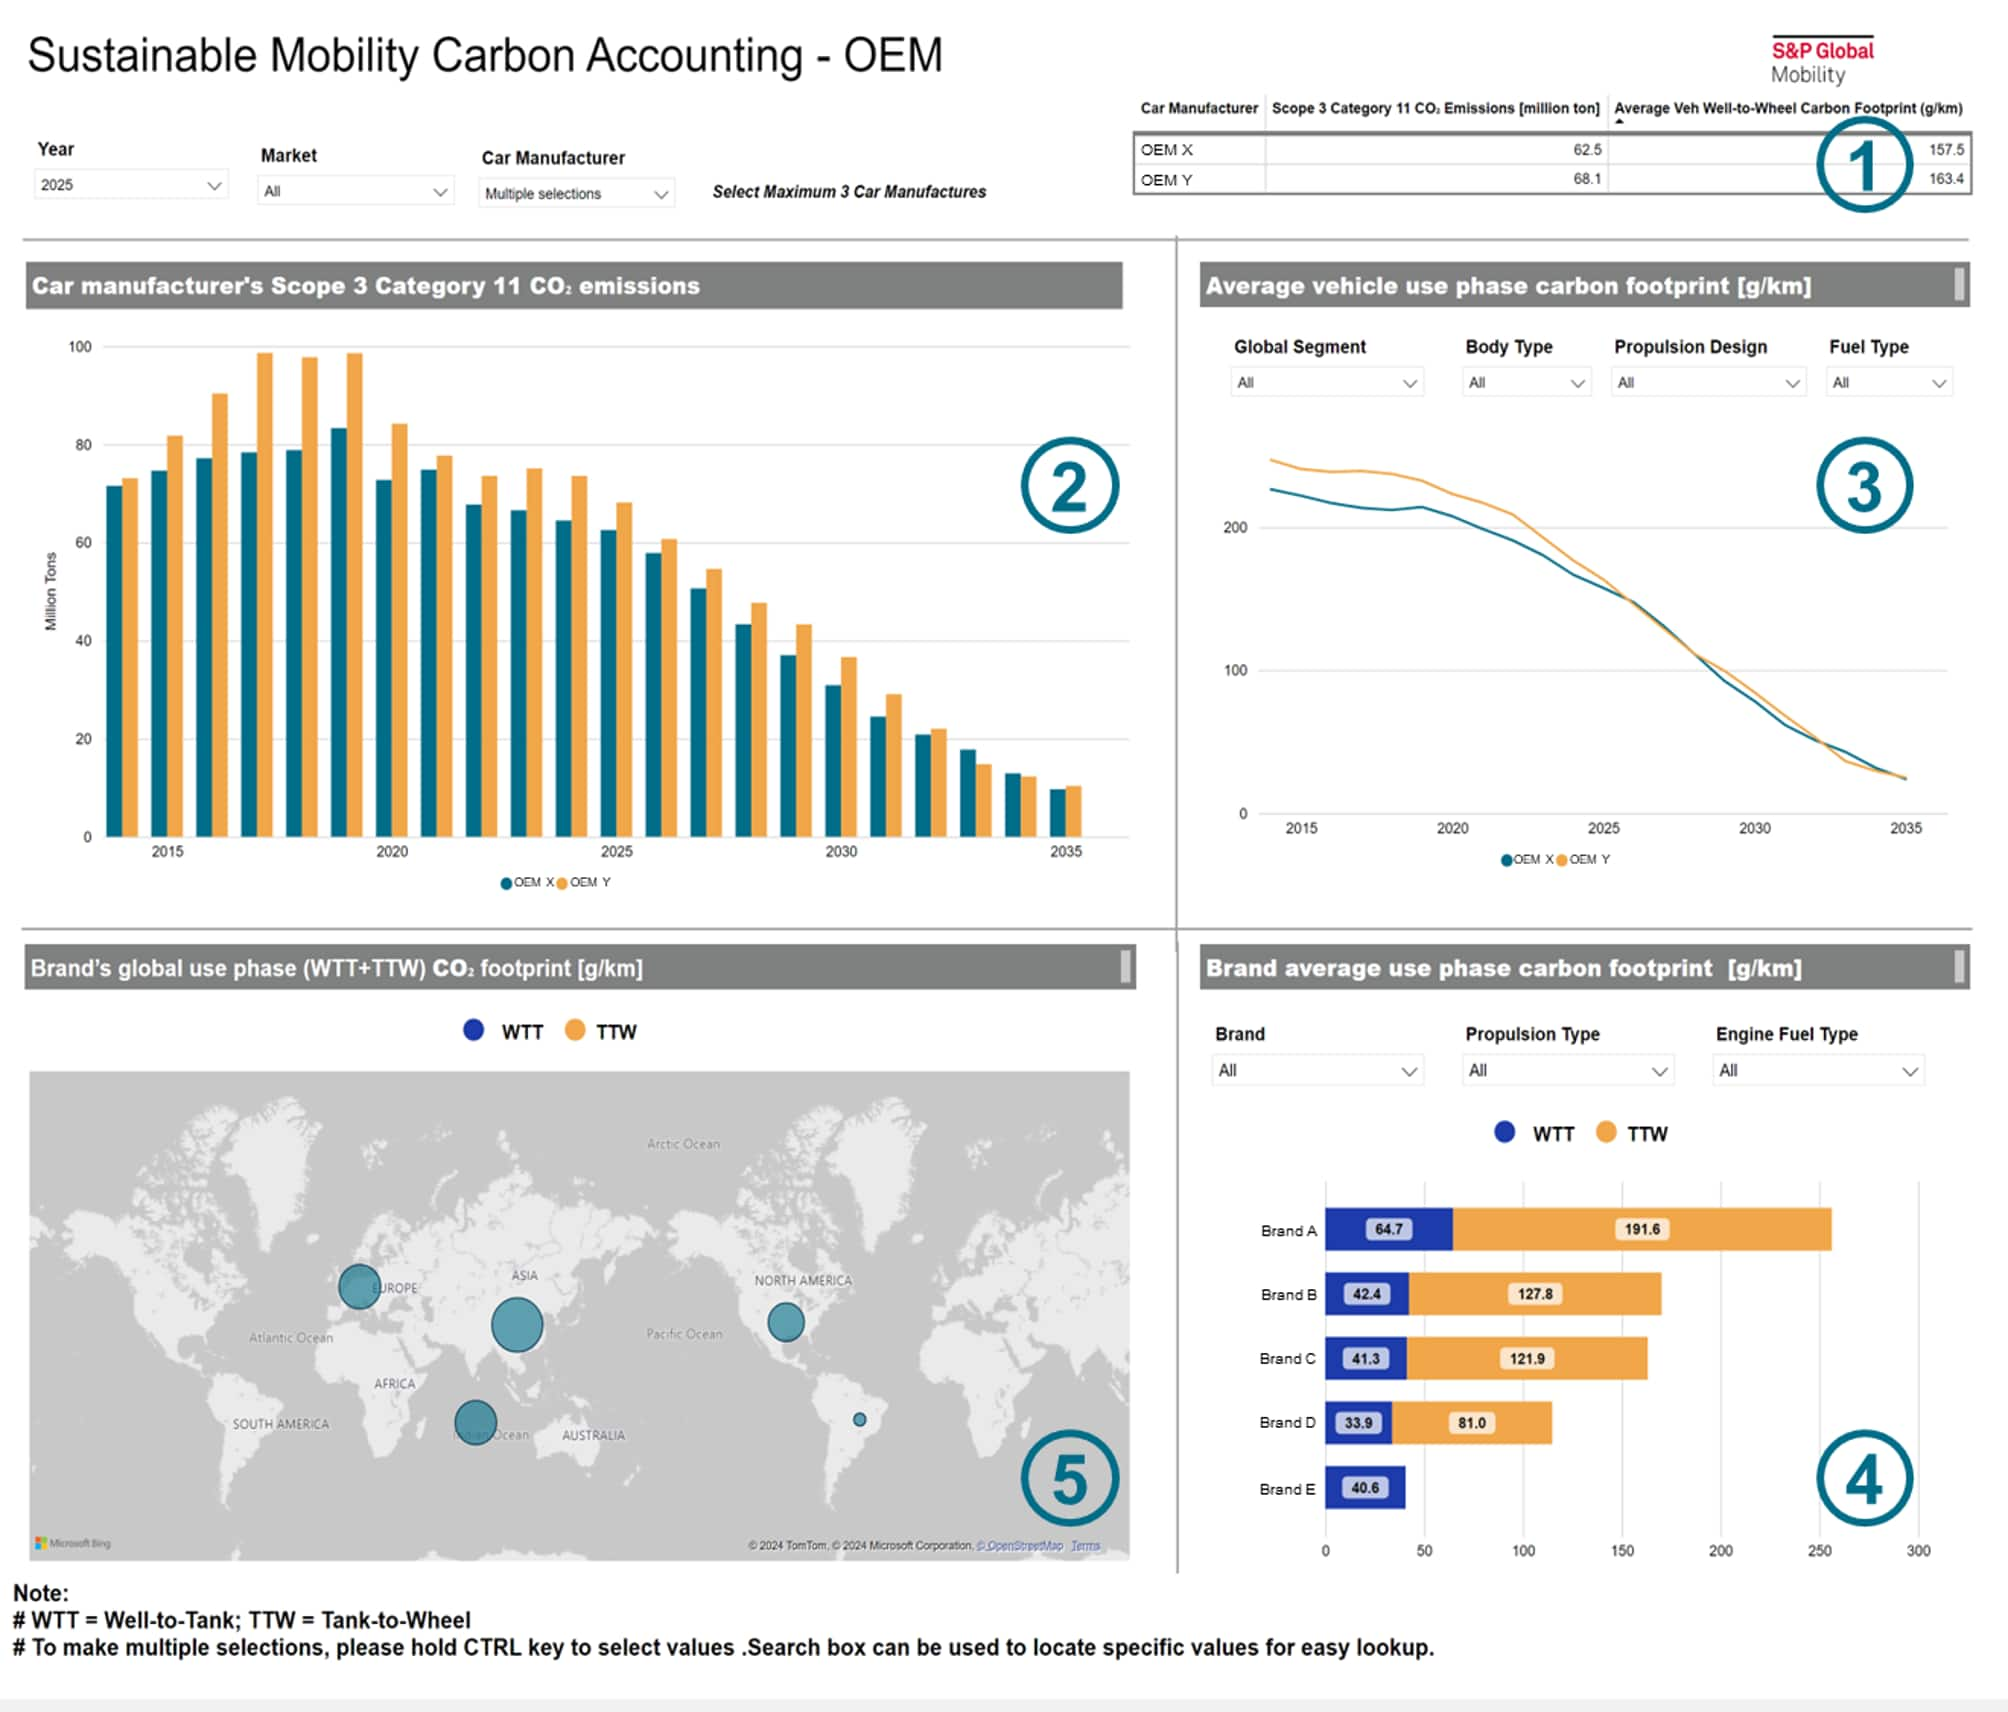
Carbon Analytics Platform: Car manufacturers and associated brands
Select OEMs and visualize their aggregated product use-phase carbon metrics, for selected regions or globally.
- OEMs' total use-phase CO2 emissions and average vehicle carbon footprint, by year
- Time series of OEMs' total Scope 3, Category 11 CO2 emissions
- Time series of average use-phase carbon footprint for vehicles sold by the OEM, filterable by segment, body type, propulsion type and fuel type
- Average use-phase carbon footprint for vehicles sold by each brand from selected OEMs, for the selected year (with additional filtering)
- Regional average use-phase carbon footprint for vehicles sold by each brand from selected OEMs, for the selected year
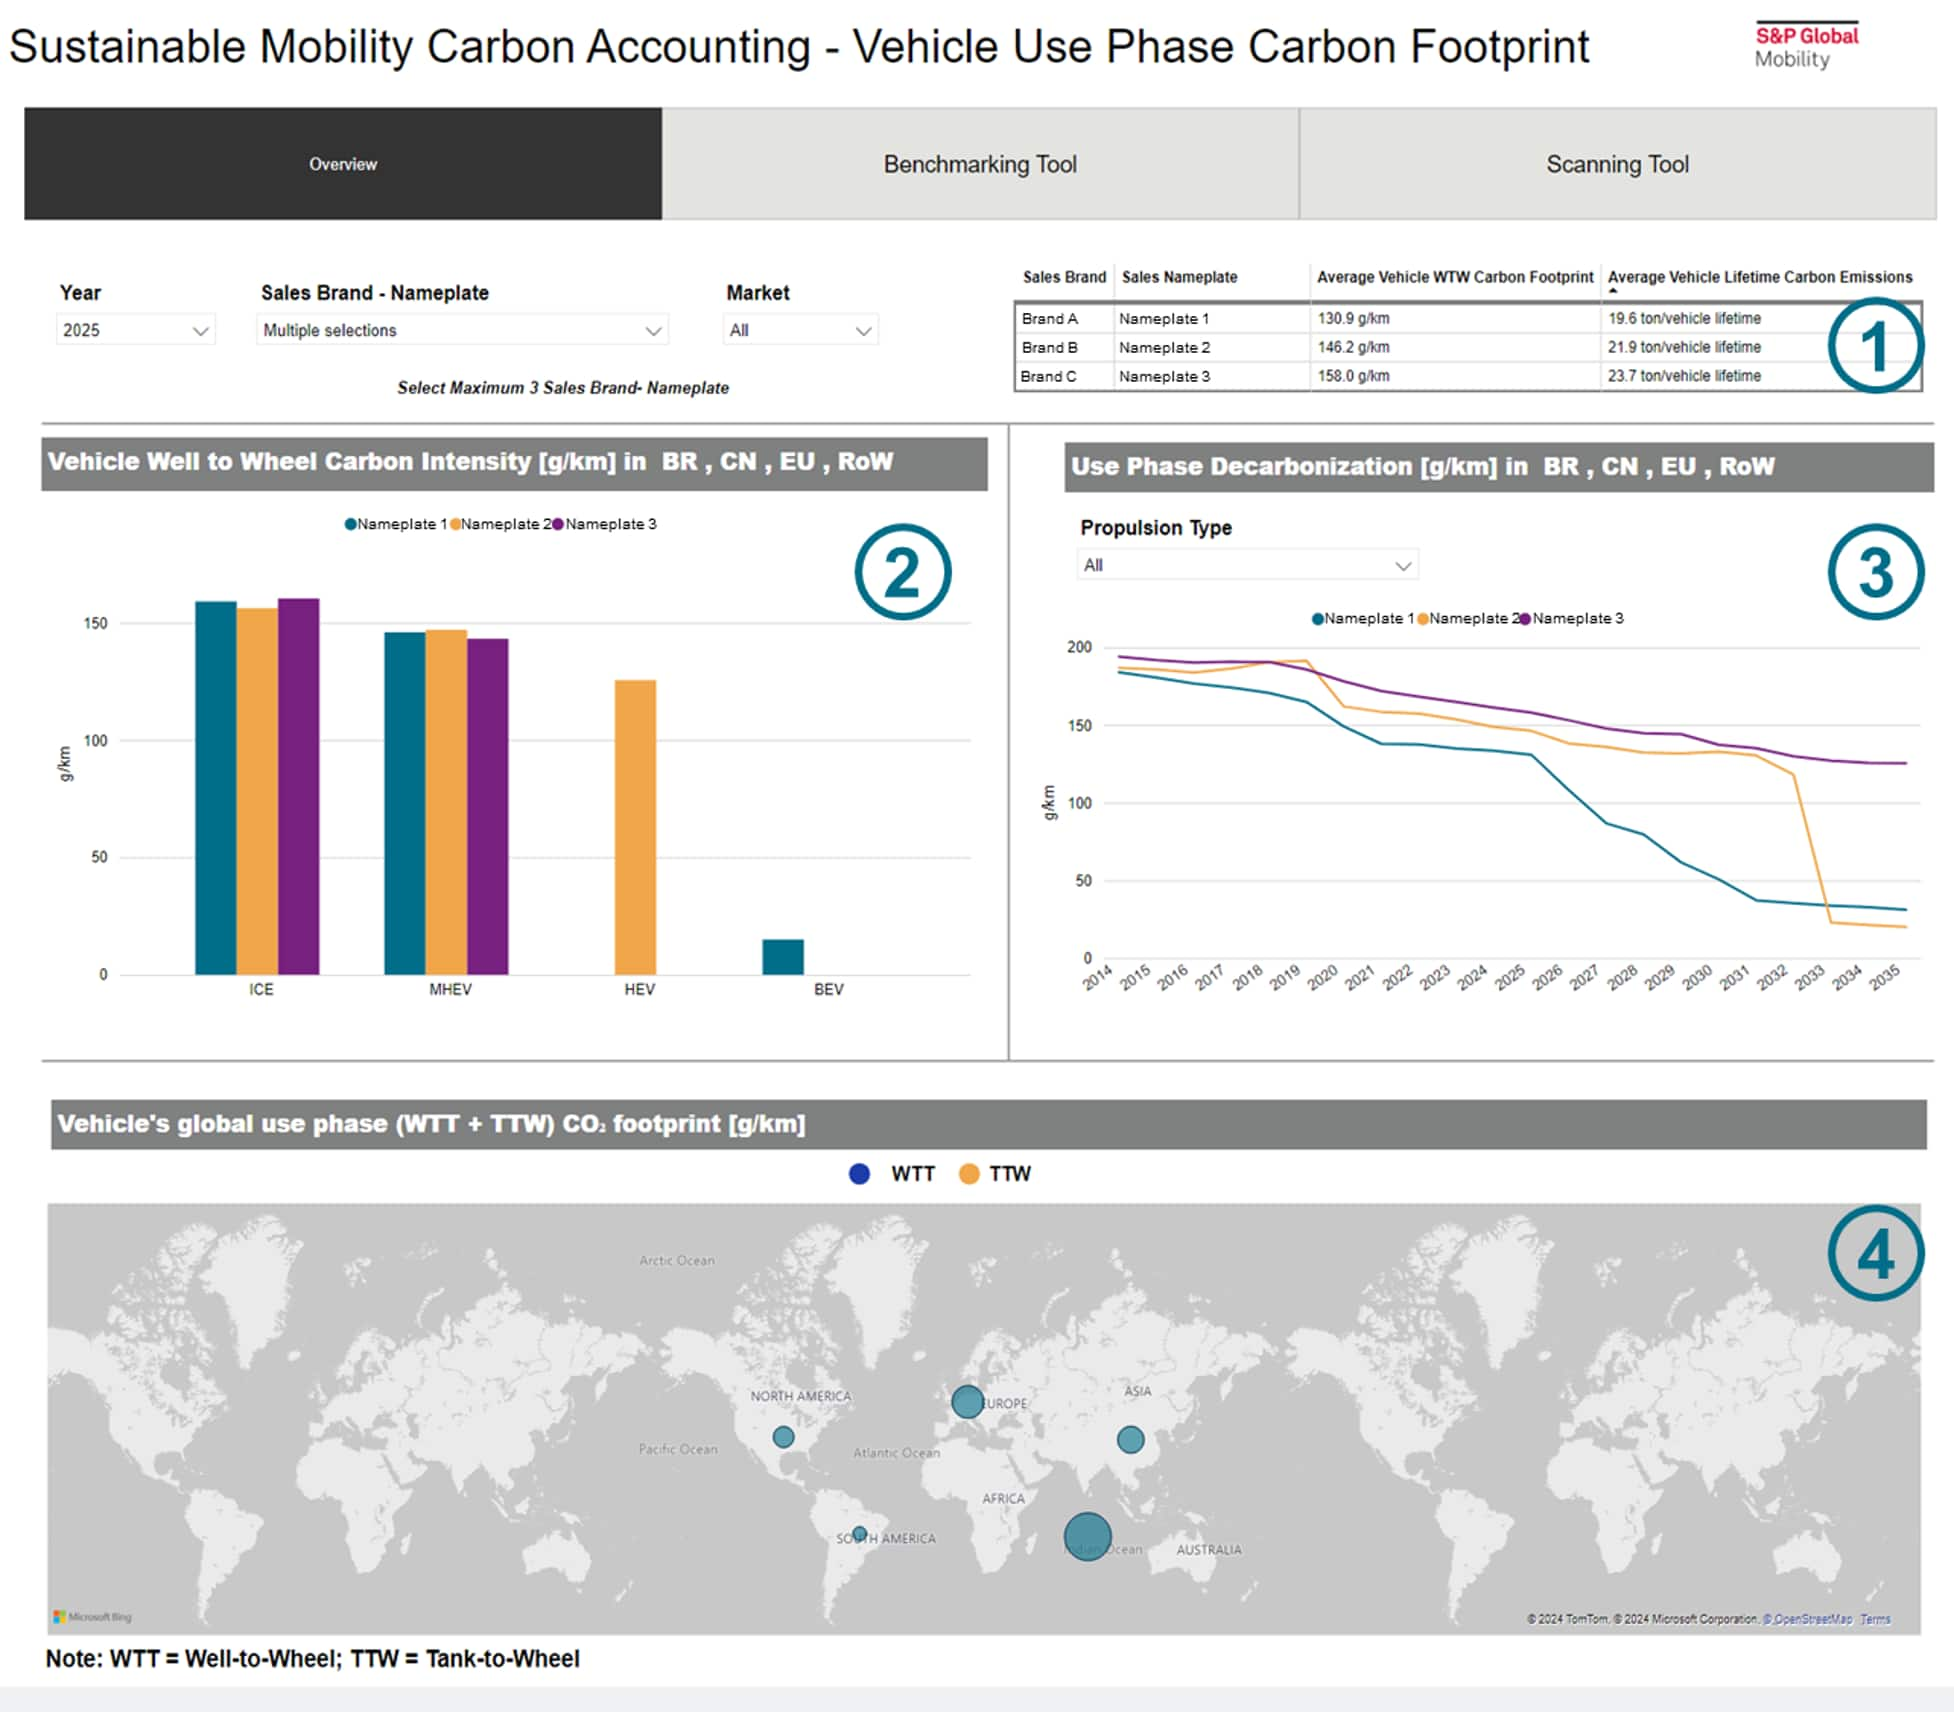
Carbon Analytics Platform: Vehicle well-to-wheel (fuel cycle) carbon footprint
Select nameplates to compare vehicle-specific well-to-wheel carbon emissions or decarbonization trends, for selected regions or globally.
- Vehicle nameplates’ average use-phase carbon footprint and average lifetime carbon emissions, filterable by region and year
- Vehicle nameplates’ average use-phase carbon footprint, for the selected year, for each propulsion type
- Time-series of vehicle nameplates’ average use-phase carbon footprint (can be additionally filtered by propulsion type)
- Regional average use phase carbon footprint for each nameplate, for the selected year
Carbon Analytics and Visualization
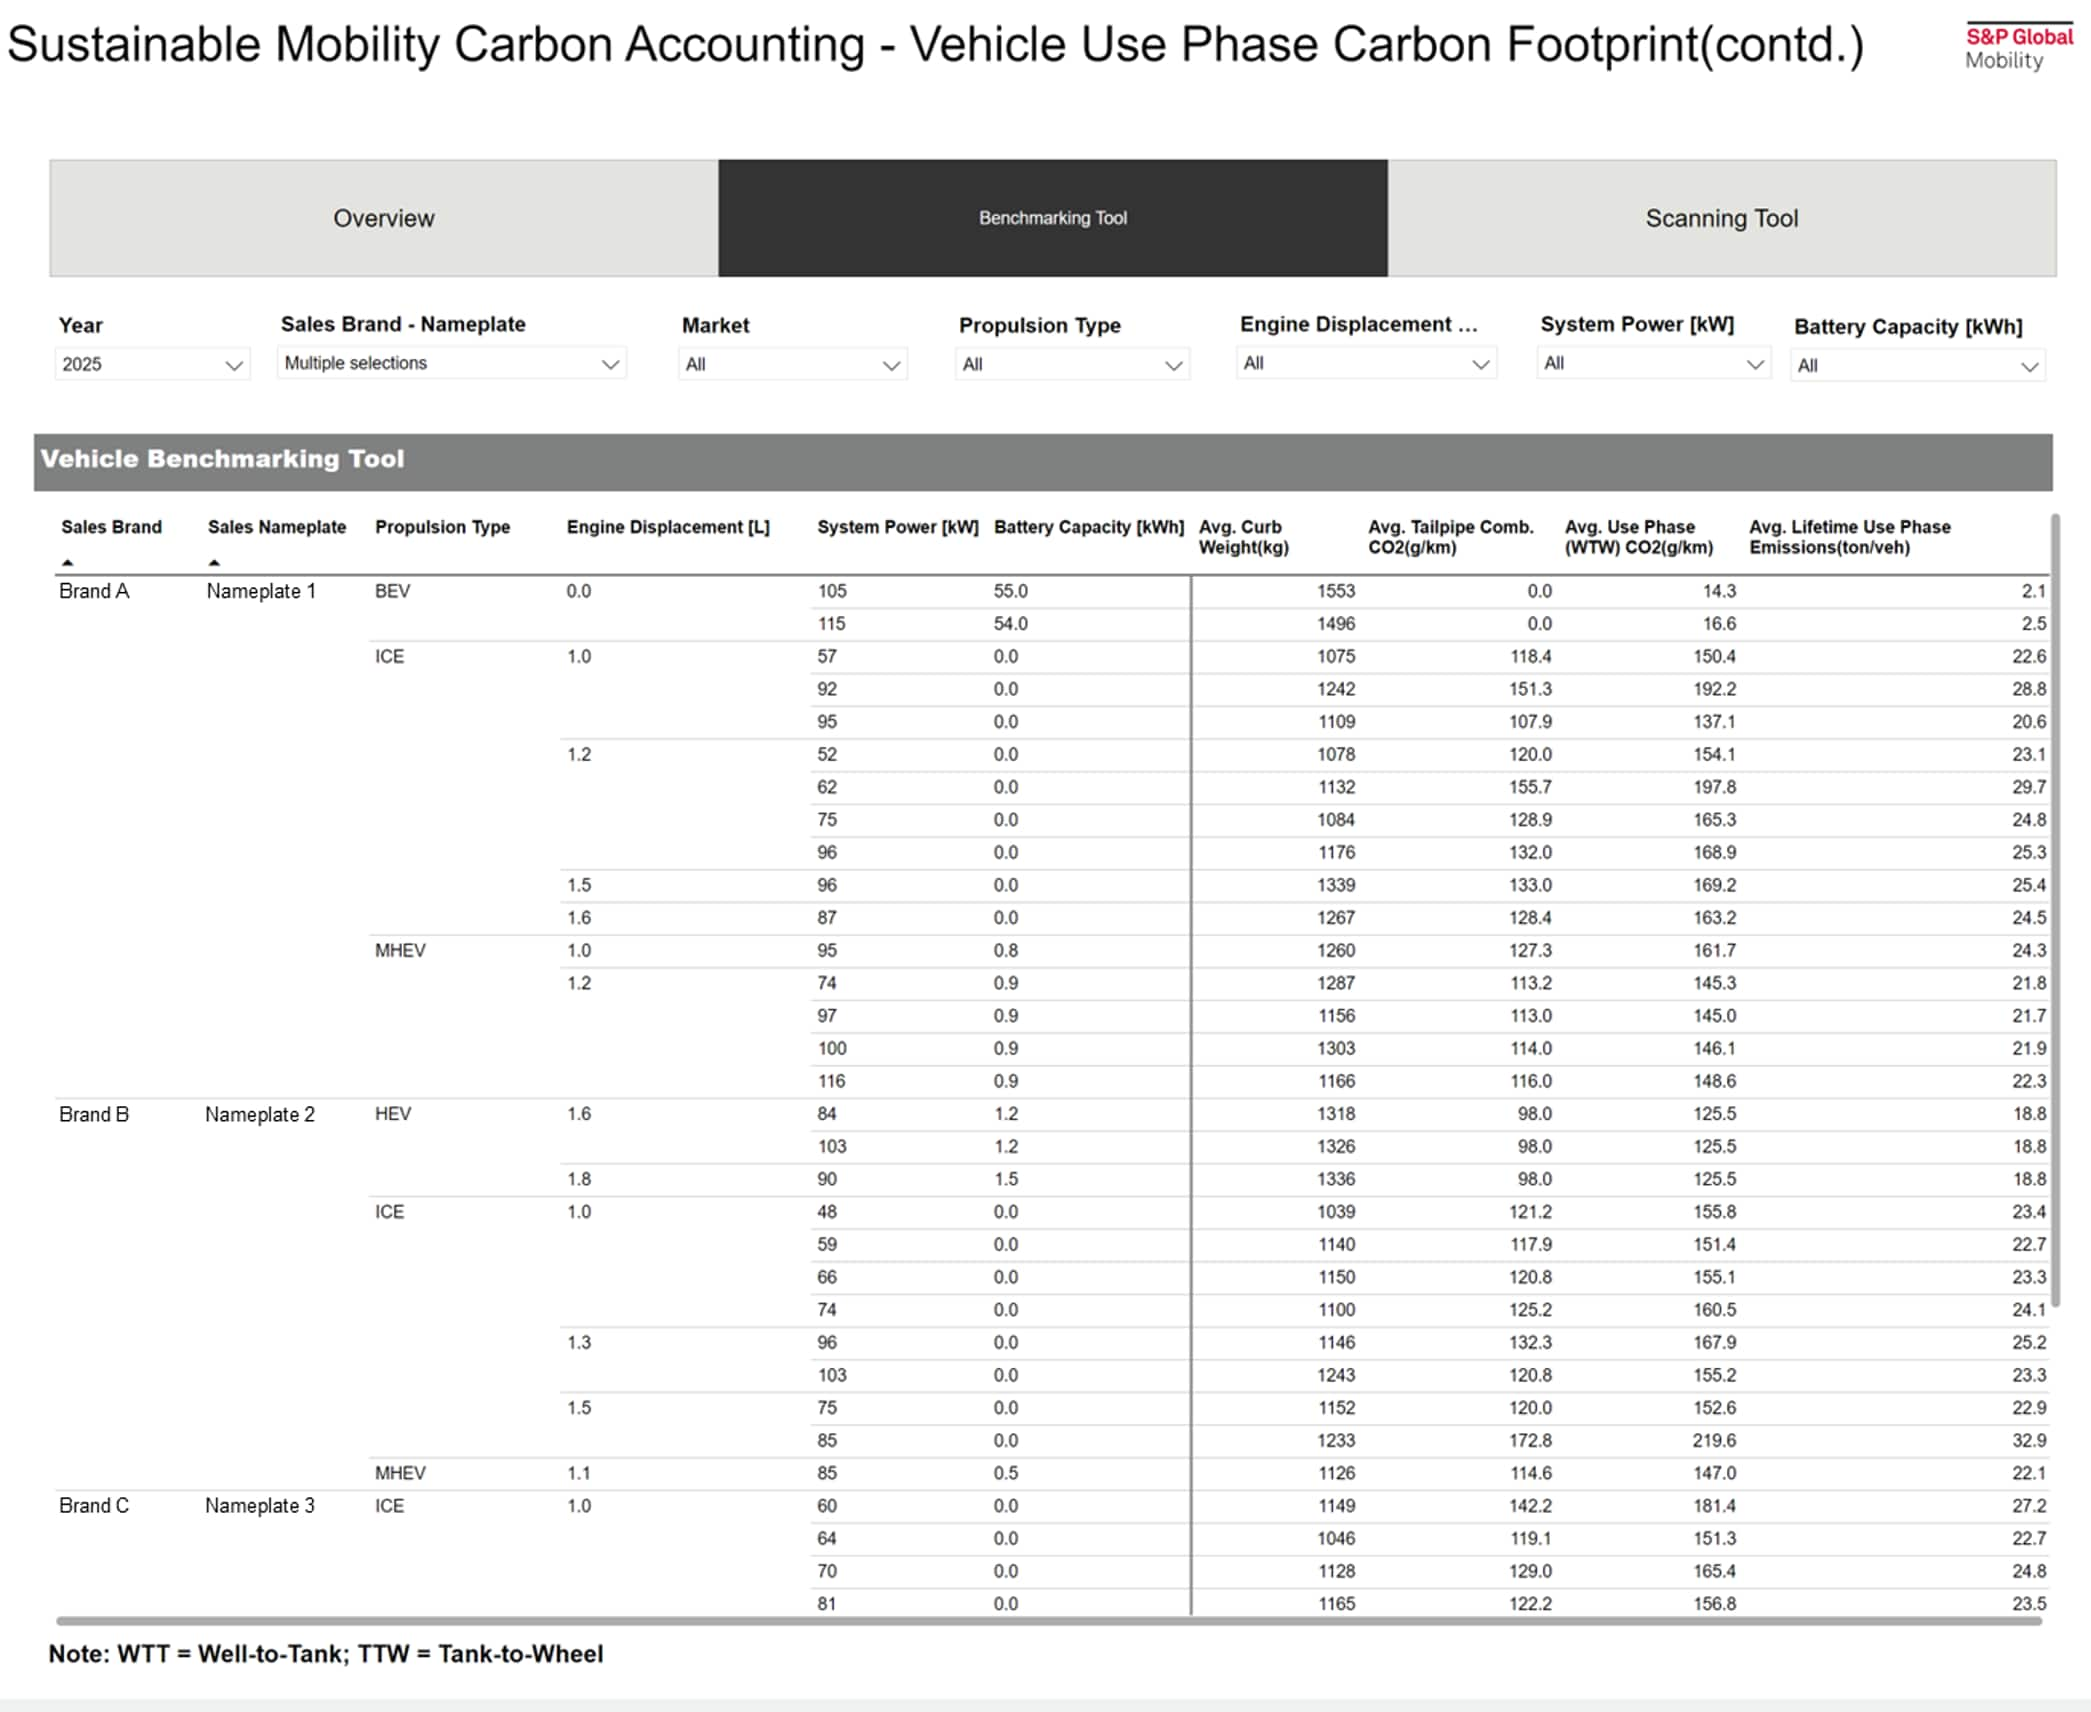
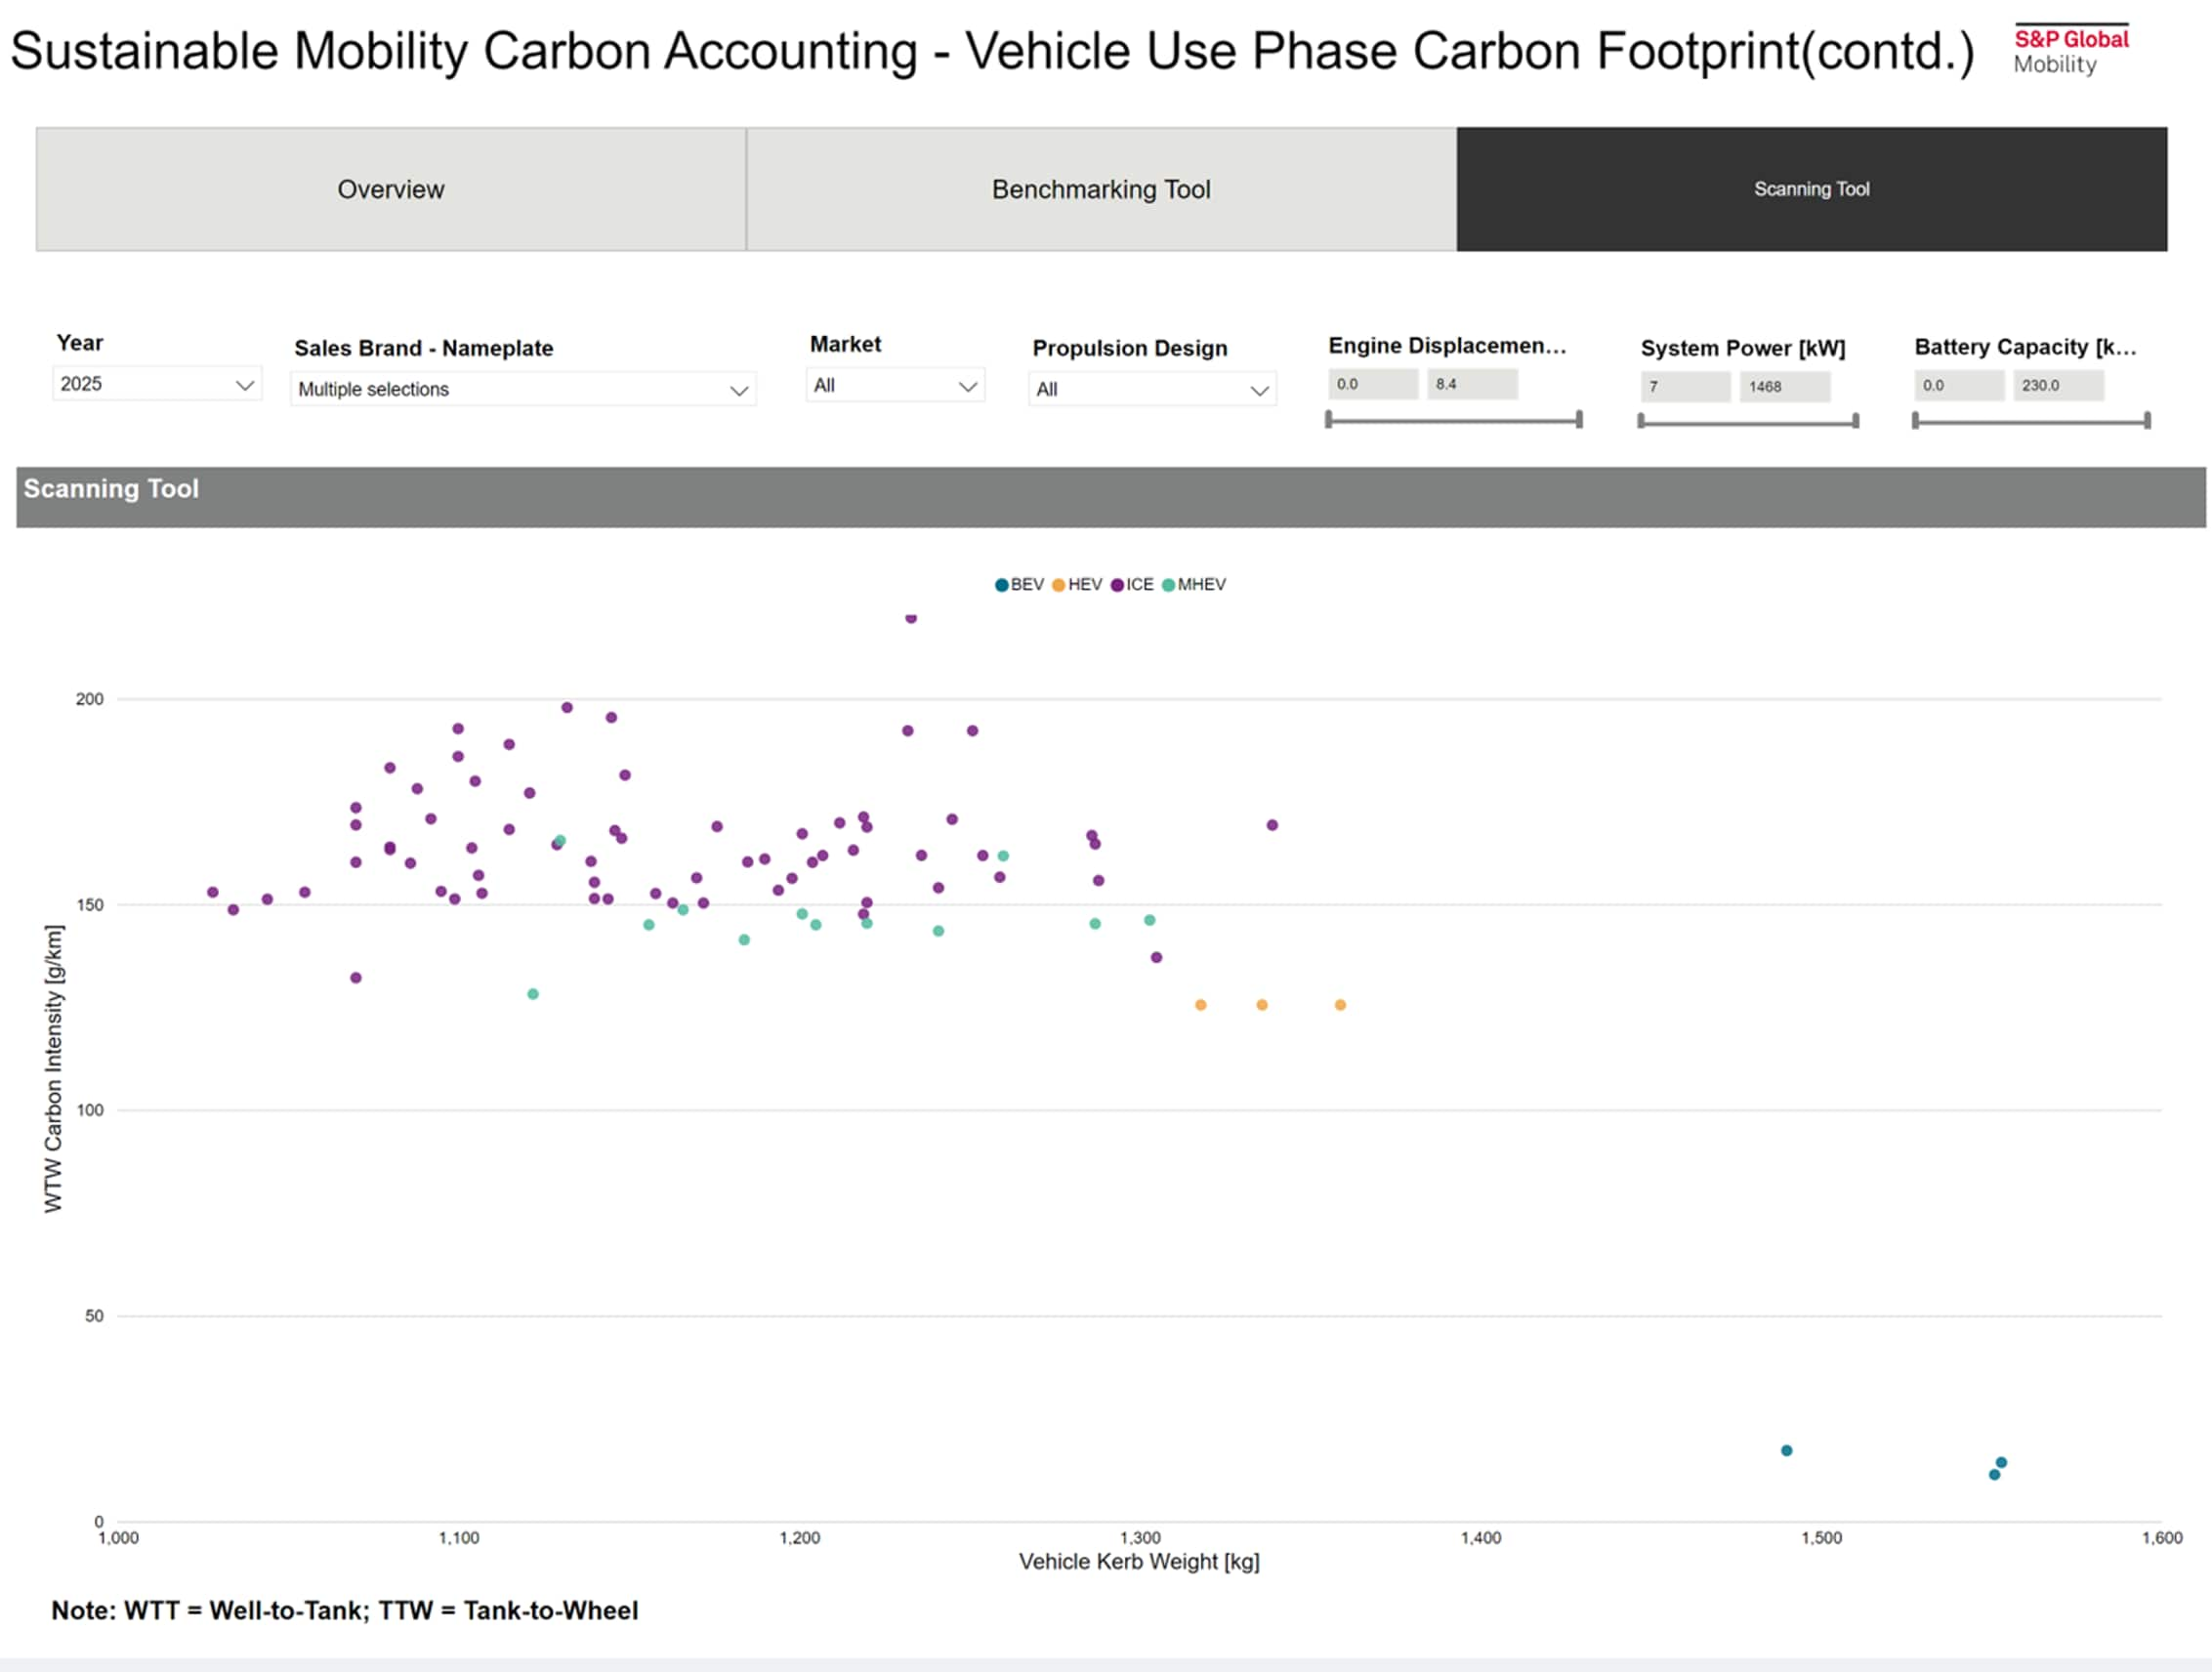
Vehicle benchmarking and scanning tool for selected year, market, and powertrain specifications
Tabular carbon benchmarking tool for easy comparison
Graphical tool to quickly scan carbon emissions data

Compare and contrast well-to-wheel CO2 emissions
Download data samples for carbon accounting
Mobility Experts
VIEW ALL