
차량 사용 단계 및 자동차 제조사 "Scope 3, Category 11" 배출량에 대한 종합 평가 및 데이터 세트
탈탄소화는 자동차 산업의 경쟁 요소입니다. 차량 판매 후 발생하는 배출량("사용 단계"라고도 하는 Scope 3 Category 11)은 자동차 제조사 및 자동차 공급업체 탄소 규모의 약 70~80%를 차지합니다. 사용 단계 탄소 규모를 줄이는 것은 주요 자동차 제조사의 주된 목표입니다. 특히, 규제 요건이 점점 더 엄격해지고 있는 환경에서 이러한 목표를 달성하지 못하면 재무적으로 큰 리스크를 초래할 수 있습니다.
신뢰할 수 있고 일관적인 탄소 배출량 계산 정보는 차량 부문 관계자의 탈탄소화 여정에서 매우 필요한 핵심 자산입니다. S&P Global Mobility는 벤치마킹, 목표 추적, 경쟁 분석, 자체 보고를 위해 일관적이고 비교 가능한 형식의 데이터 세트를 제공합니다.
자동차 탄소 배출량 계산의 혜택
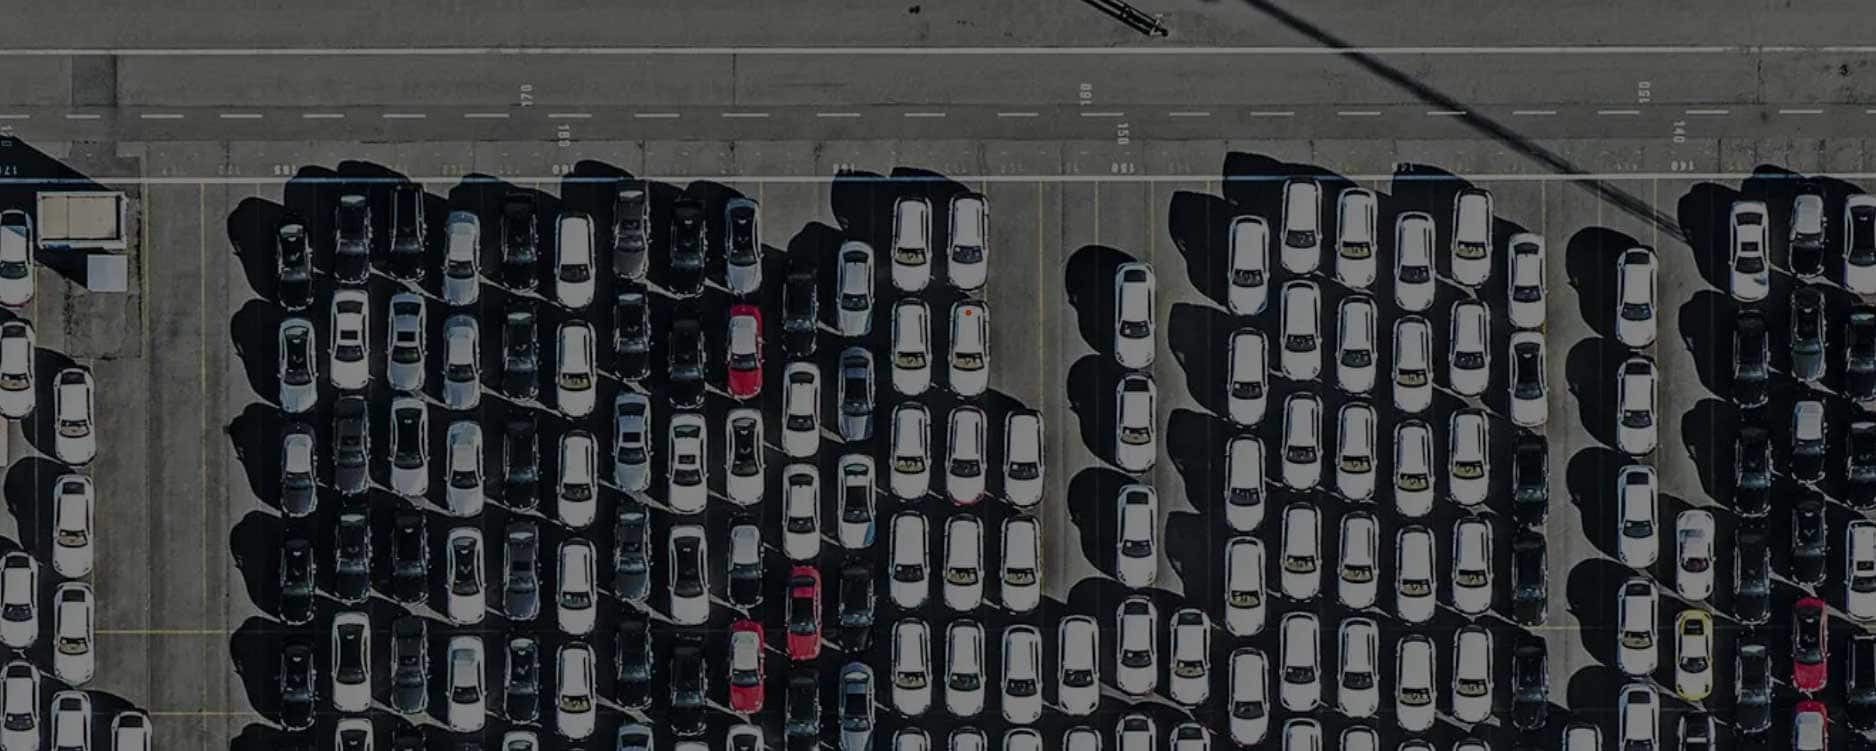
탄소 배출량 계산 Scope 3 Category 11 솔루션은 글로벌 자동차 제조사 및 차량 모델의 라이프사이클 탄소 배출량(WTT(연료의 전과정평가) 배출량 사용 단계 포함)에 대한 포괄적인 데이터 세트를 제공합니다.
데이터베이스를 통해 차량 부문 관계자는 다음을 수행할 수 있습니다.
- 탄소 배출량 계산에 대한 자체 보고
- 탄소 배출량 감축 목표에 대한 업계 벤치마크 설정
- 산업/기업의 탈탄소화 목표 달성 추적
- 탄소 감축 목표 달성을 위한 경쟁 전략 계획 수립
- 탈탄소화 노력을 향상하기 위한 공급망 또는 투자 의사결정
- 신뢰할 수 있는 데이터 소스 및 일관적인 방법론 사용.
WTT CO2 배출량 비교 및 대조
탄소 배출량 계산을 위한 데이터 샘플 다운로드
자동차 탄소 배출량 계산 데이터 세트의 혜택을 누릴 수 있는 대상은 누구인가요?

금융 기관
- 전반적인 자동차 기술 동향 및 사용 단계에서의 탈탄소화에 미치는 영향 이해
- 업계 벤치마크, 모범 사례의 파악 및 탈탄소화 목표를 설정하여 시장 주도
- 세분화되고 일관적인 데이터 소스 및 방법론을 기반으로 구축된 신뢰성이 높은 데이터로 Scope 3 금융 배출량 보고
OEMs
- 전반적인 자동차 기술 동향 및 사용 단계에서의 탈탄소화에 미치는 영향 이해
- 업계 벤치마크, 모범 사례의 파악 및 탈탄소화 목표를 설정하여 시장 주도
- 세분화되고 일관적인 데이터 소스 및 방법론을 기반으로 구축된 신뢰성이 높은 데이터로 Scope 3 금융 배출량 보고

차량 공급업체
- 기술 개발에 의해 주도되는 자동차 제조업체의 단계적 탈탄소화 추세를 이해
- 클라이언트의 기술 변화와 시장 규제의 역동성에 맞춰 제품 관리에 대한 정보를 얻고 준비
- 할당된 Scope 3 사용 단계 탄소 배출량을 보고하고, 신뢰할 수 있으며 세부적인 차량 사용 단계의 탄소 발자국 데이터를 사용하여 탈탄소화 전략 수립

How much carbon is hidden in your investment portfolios?
Webinar | 1 August 2024
Carbon Analytics Platform: Car manufacturers and associated brands
Select OEMs and visualize their aggregated product use-phase carbon metrics, for selected regions or globally.
- OEMs' total use-phase CO2 emissions and average vehicle carbon footprint, by year
- Time series of OEMs' total Scope 3, Category 11 CO2 emissions
- Time series of average use-phase carbon footprint for vehicles sold by the OEM, filterable by segment, body type, propulsion type and fuel type
- Average use-phase carbon footprint for vehicles sold by each brand from selected OEMs, for the selected year (with additional filtering)
- Regional average use-phase carbon footprint for vehicles sold by each brand from selected OEMs, for the selected year
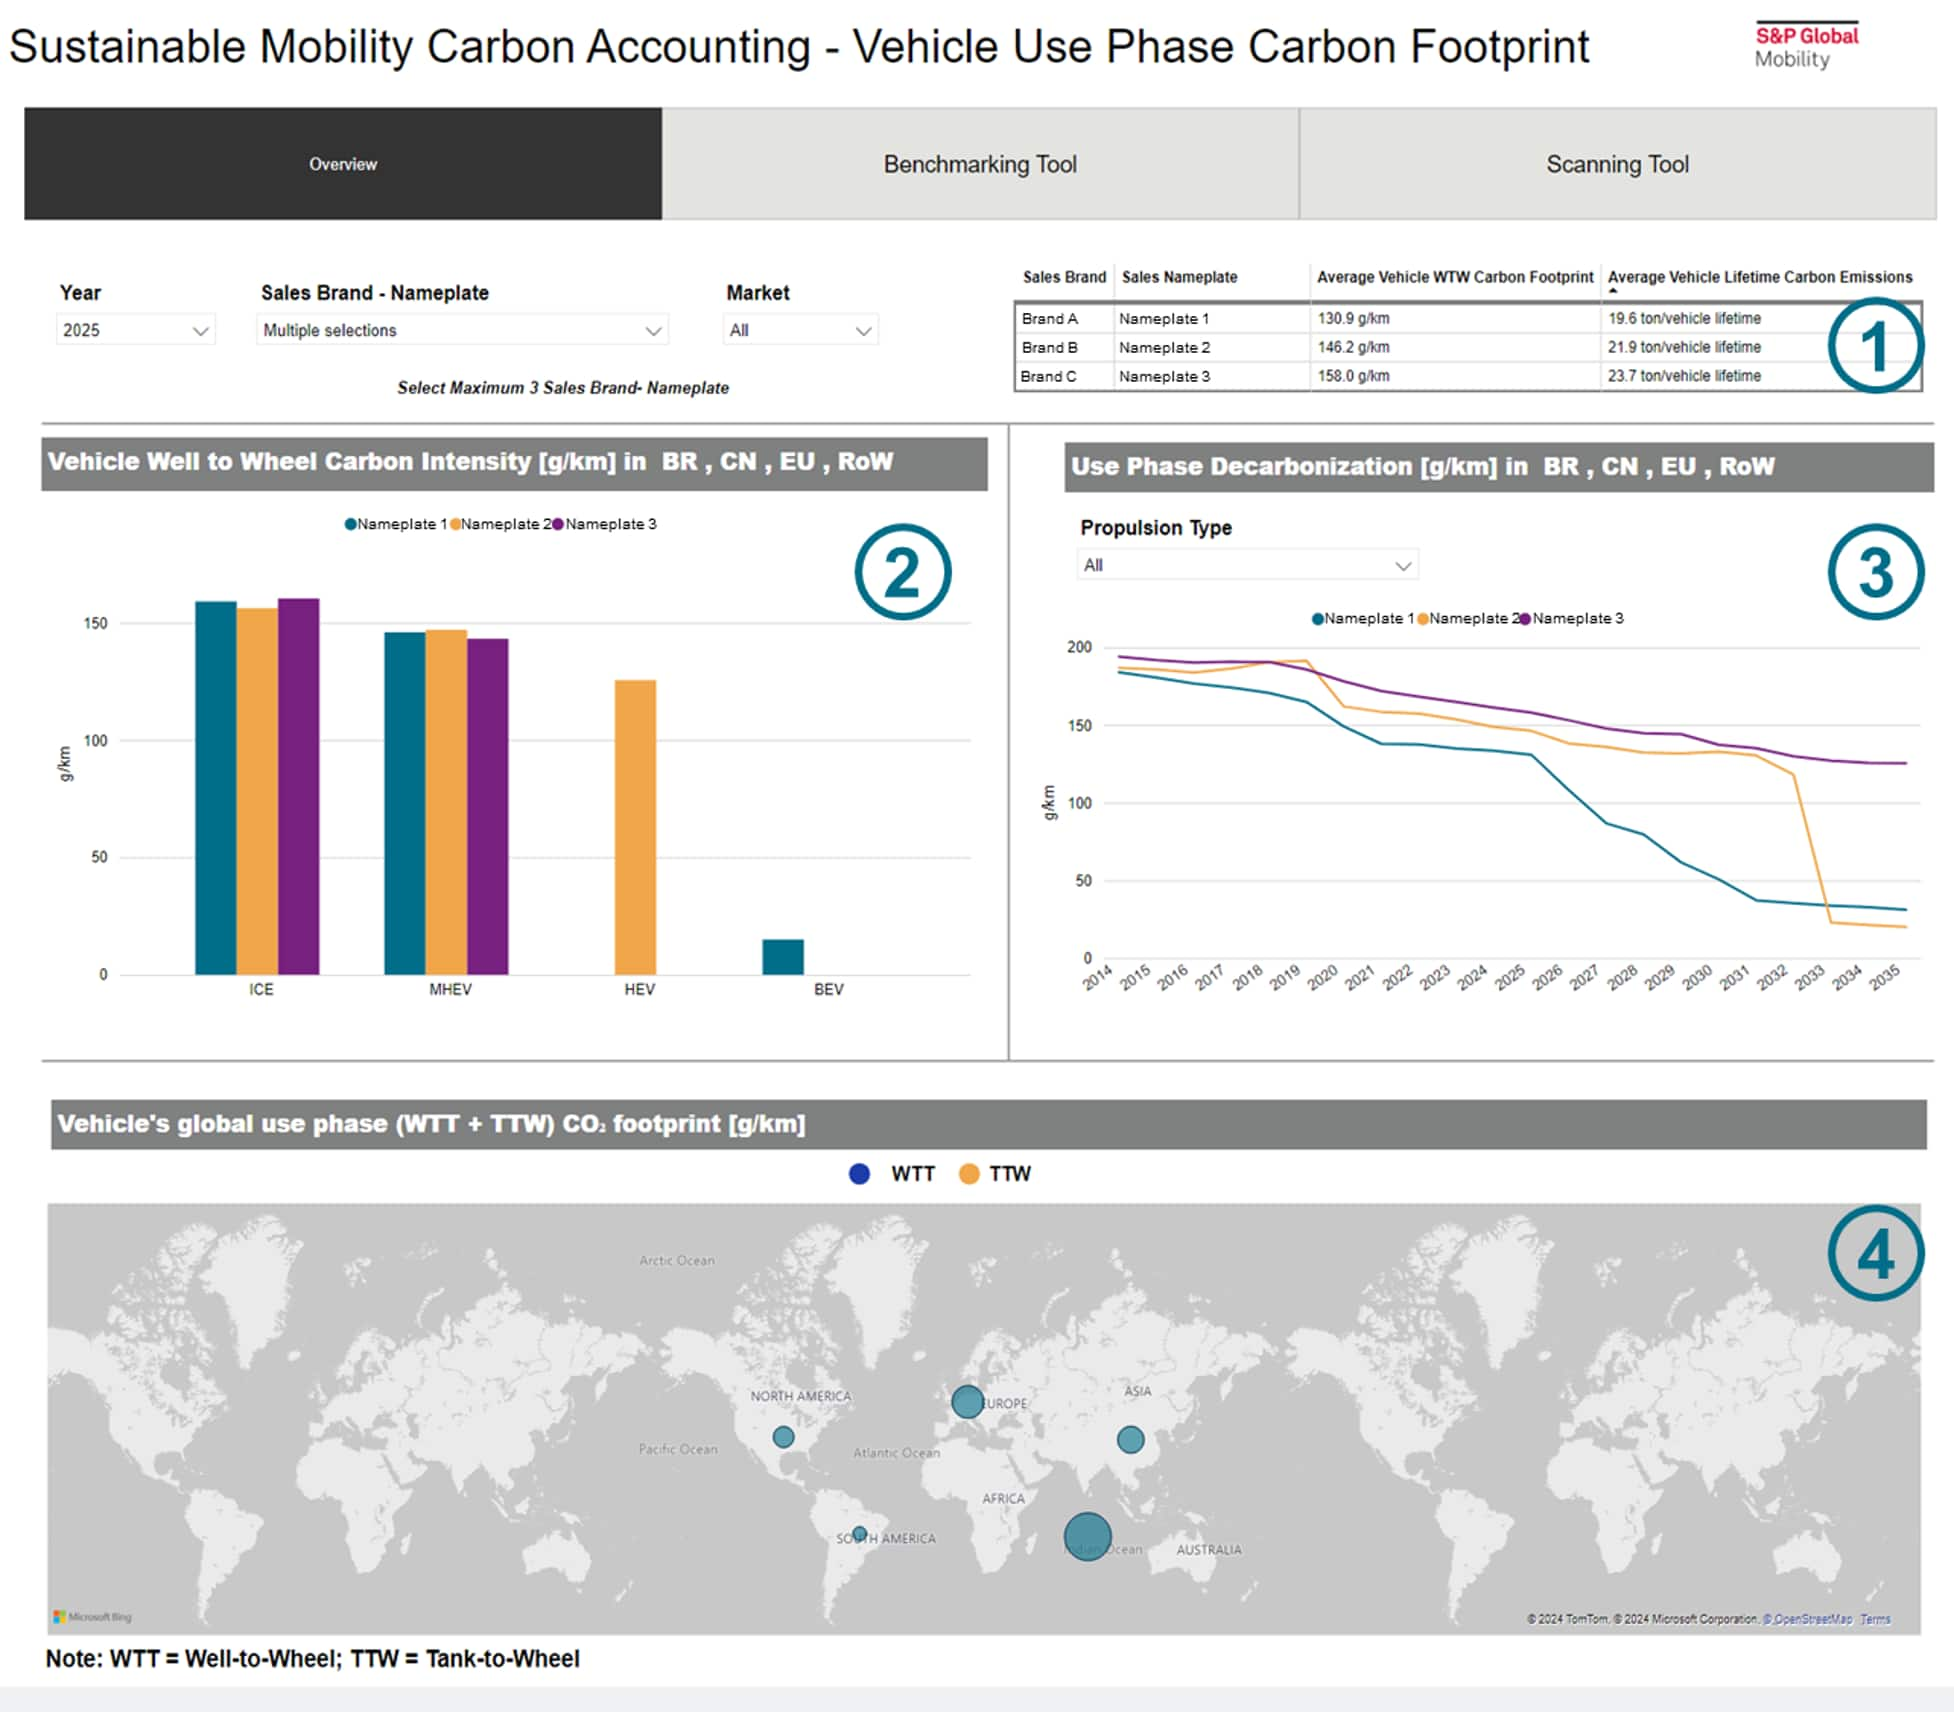
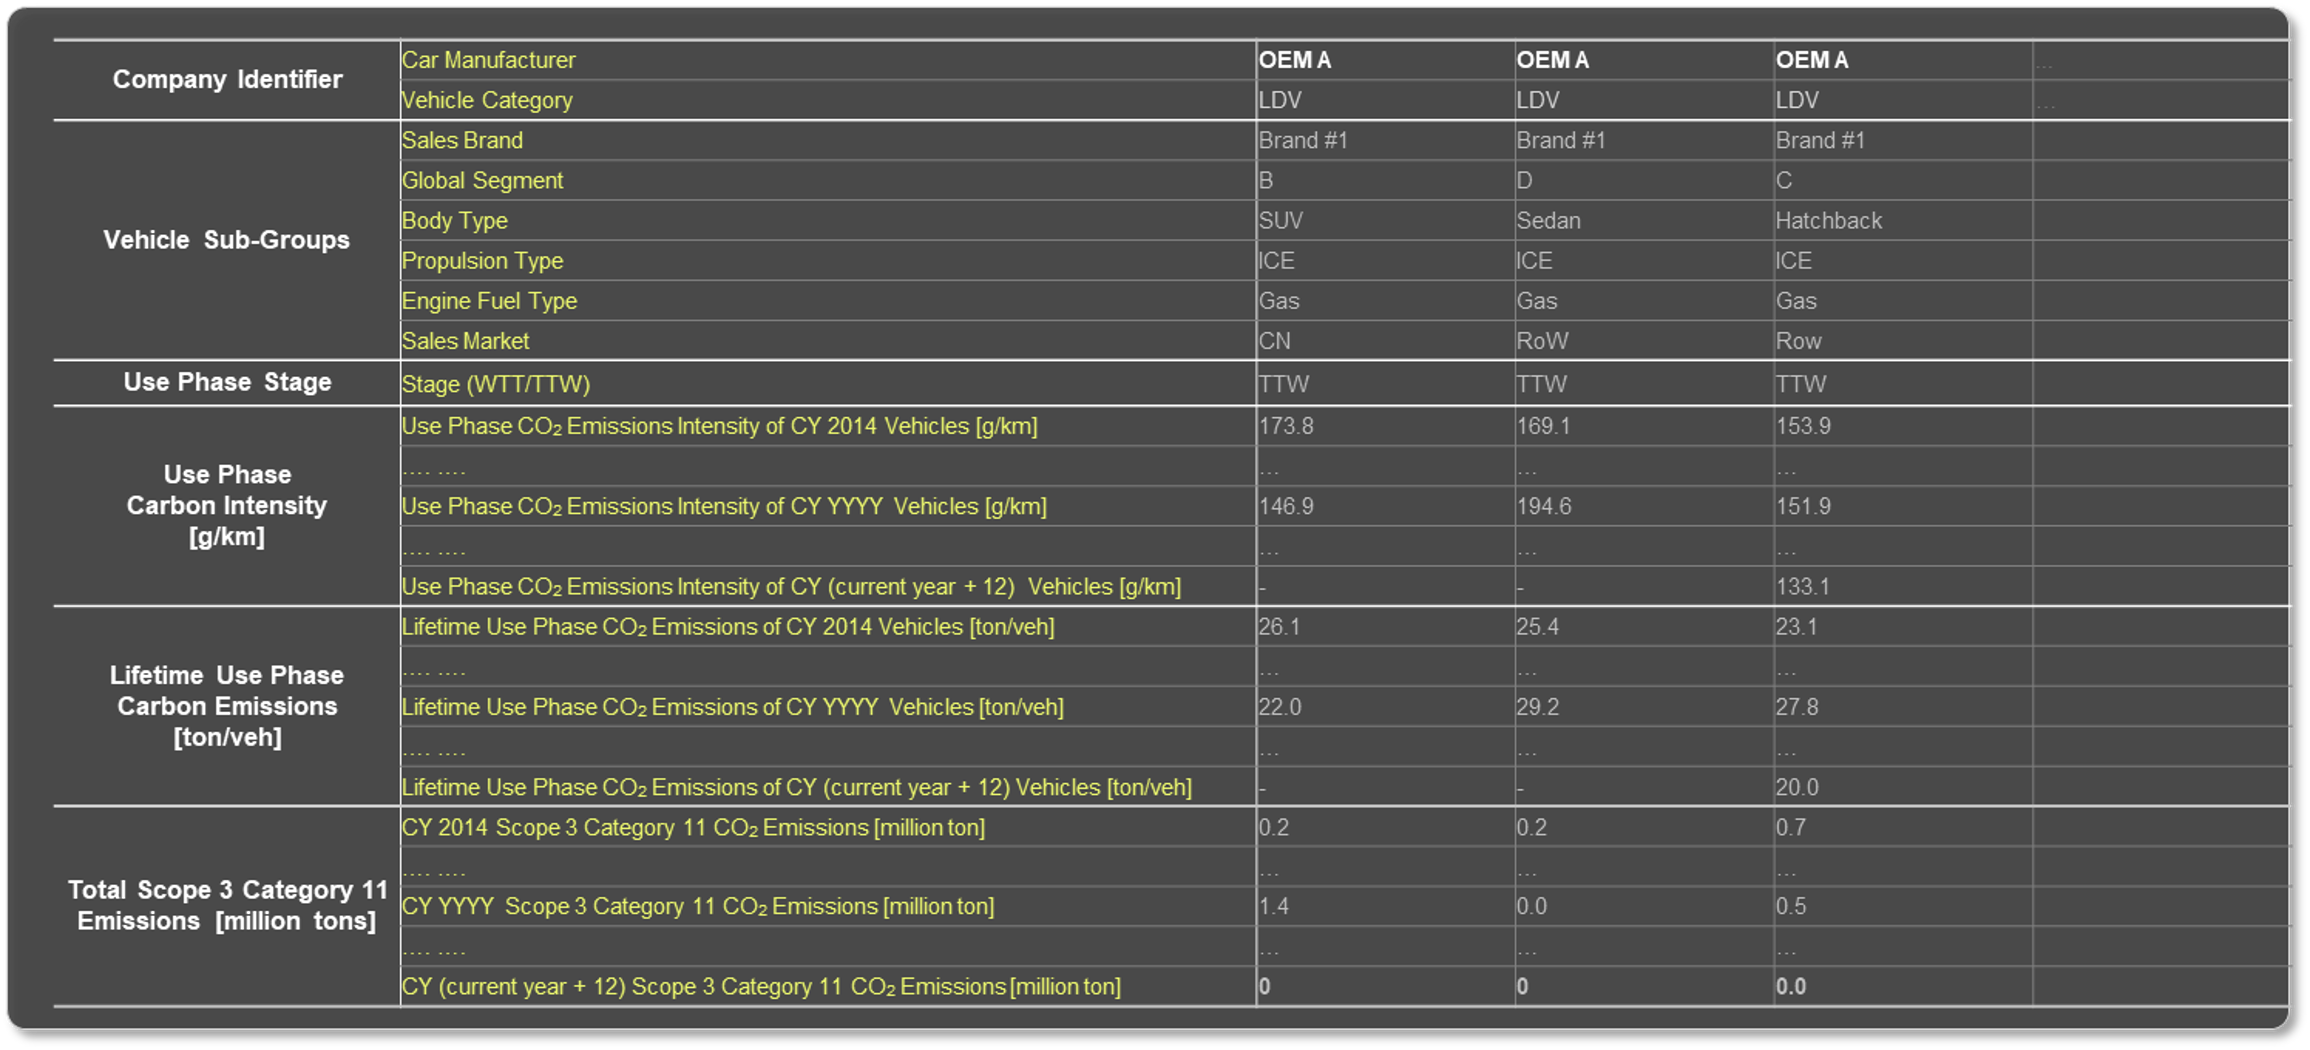
Carbon Analytics Platform: Vehicle well-to-wheel (fuel cycle) carbon footprint
Select nameplates to compare vehicle-specific well-to-wheel carbon emissions or decarbonization trends, for selected regions or globally.
- Vehicle nameplates’ average use-phase carbon footprint and average lifetime carbon emissions, filterable by region and year
- Vehicle nameplates’ average use-phase carbon footprint, for the selected year, for each propulsion type
- Time-series of vehicle nameplates’ average use-phase carbon footprint (can be additionally filtered by propulsion type)
- Regional average use phase carbon footprint for each nameplate, for the selected year
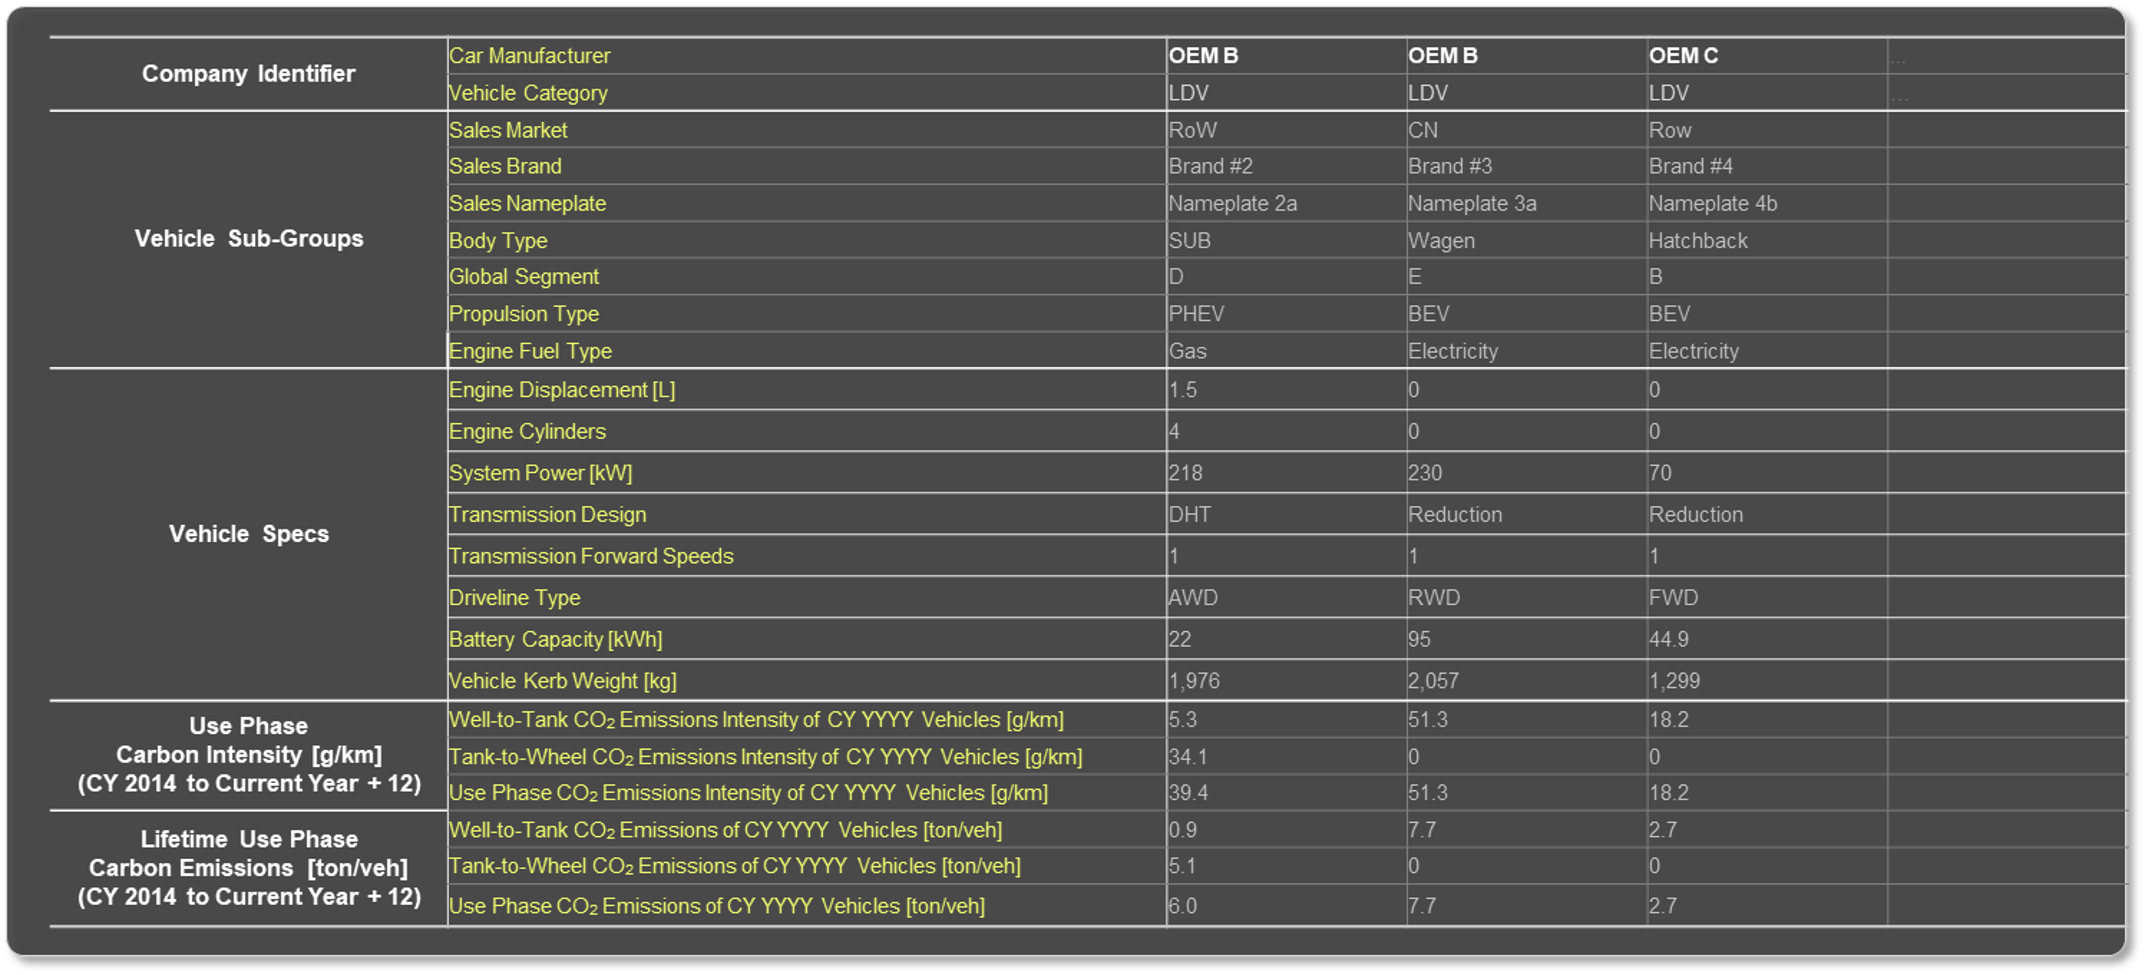
Carbon Analytics and Visualization
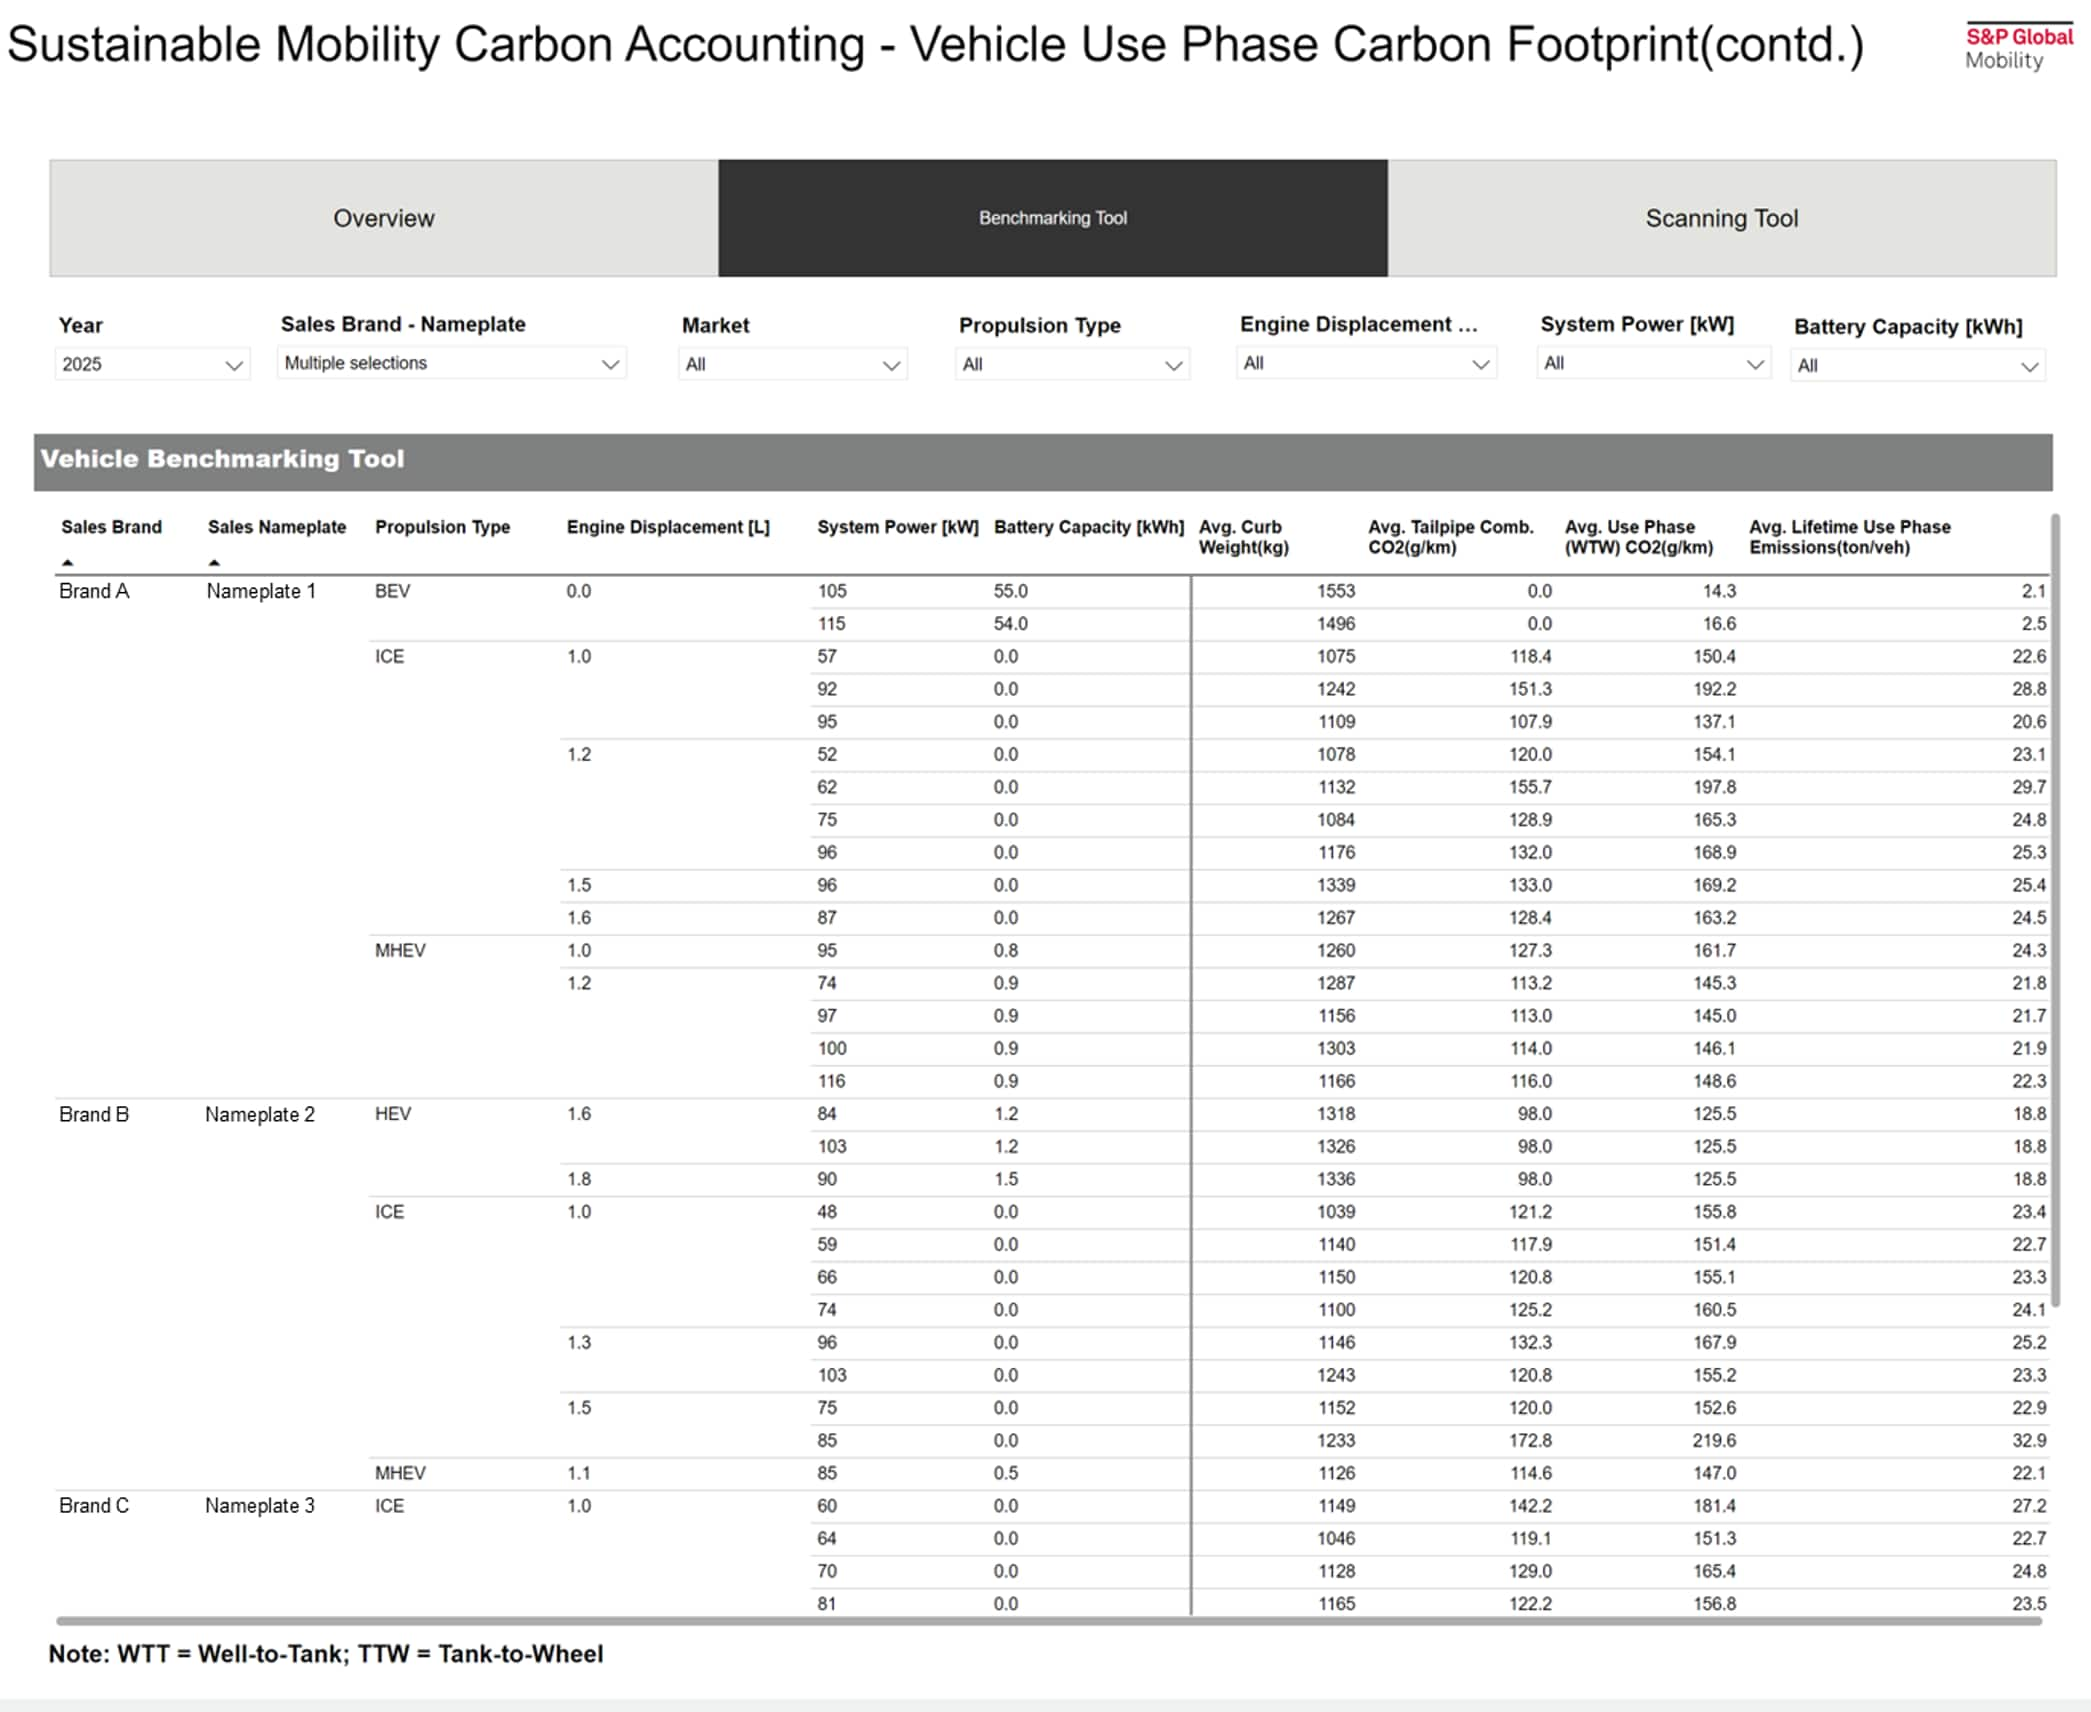
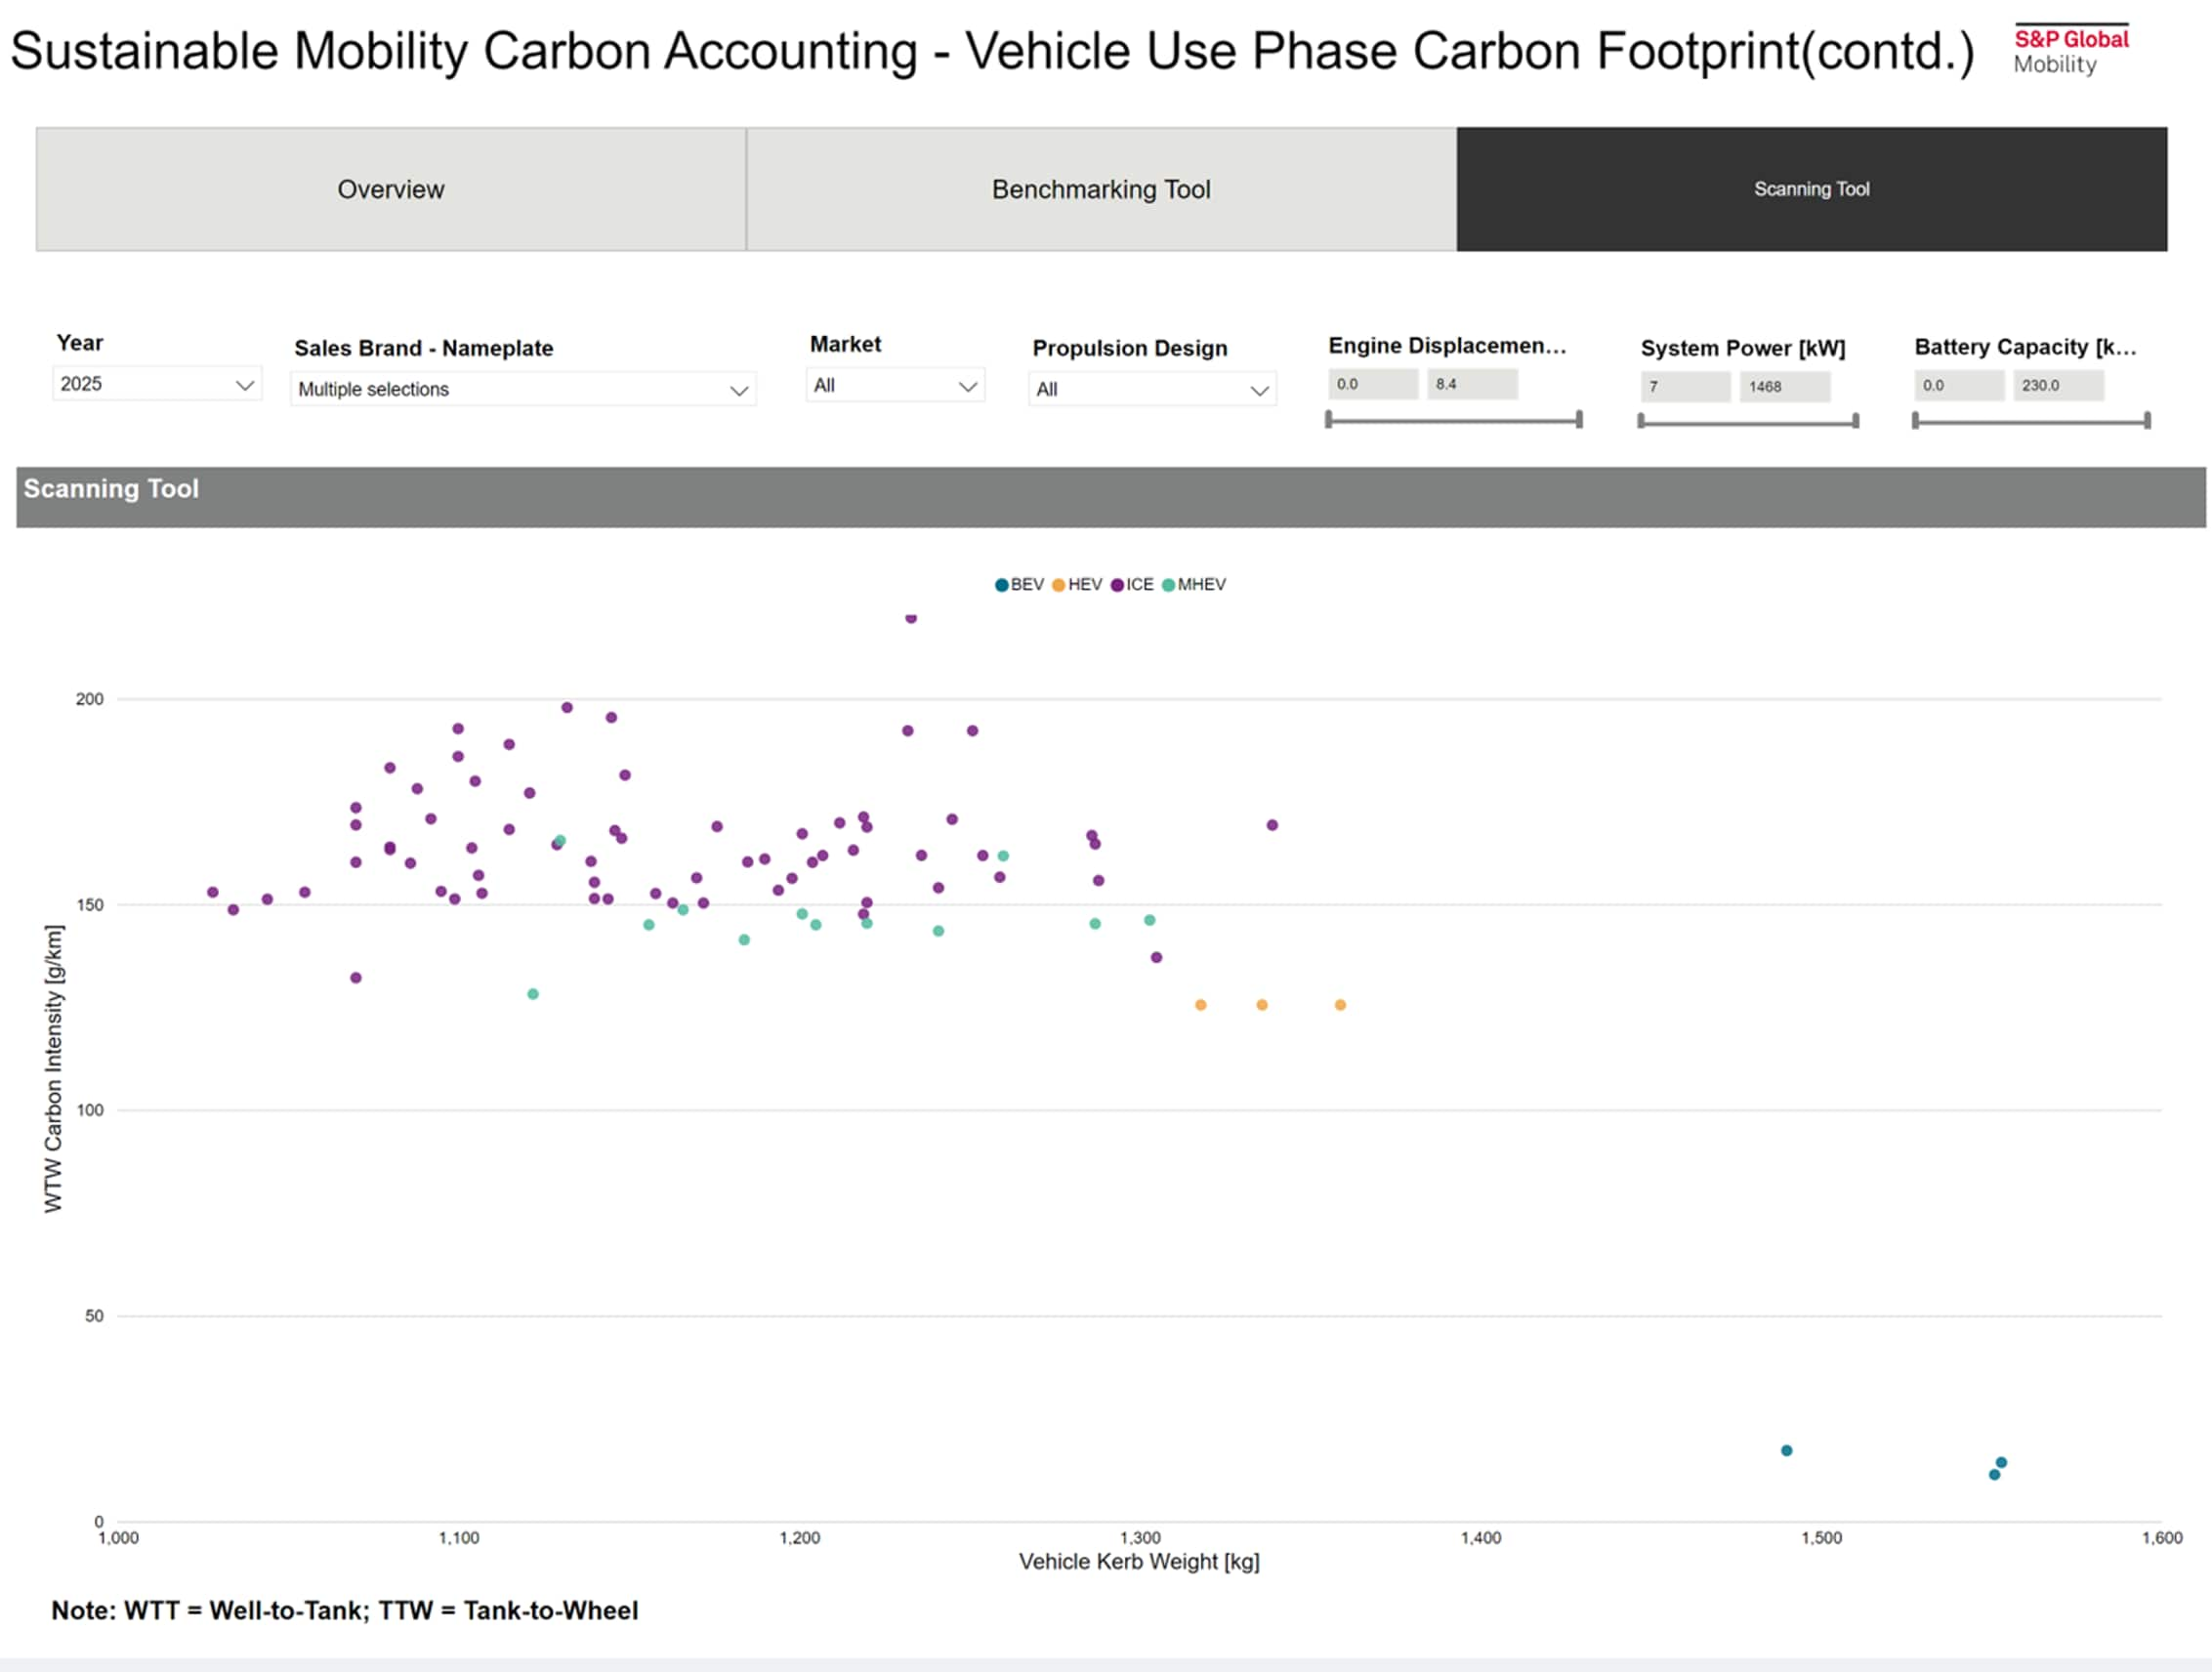
Vehicle benchmarking and scanning tool for selected year, market, and powertrain specifications
Tabular carbon benchmarking tool for easy comparison
Graphical tool to quickly scan carbon emissions data

Compare and contrast well-to-wheel CO2 emissions
Download data samples for carbon accounting
Mobility Experts
VIEW ALL