Customer Logins
Obtain the data you need to make the most informed decisions by accessing our extensive portfolio of information, analytics, and expertise. Sign in to the product or service center of your choice.
Customer Logins
ECONOMICS COMMENTARY
May 04, 2020
Understanding US manufacturing PMIs, and how supplier shortages are giving an artificial boost to the PMI amid the coronavirus outbreak
- Manufacturing PMI™ data came in above consensus in April, but the headline numbers mask a production downturn that is surpassing that seen in the global financial crisis
- Supplier delivery delays, linked to the COVID-19 supply shock, have artificially boosted the PMI
- Analysts need to look beyond the headline PMI to get a true indication of manufacturing health
Analysts breathed a sigh of relief after US PMI data showed the manufacturing downturn to have not been as severe as expected in April, as COVID-19 related shutdowns hit the factory sector. However, the decline signalled by the surveys was steeper than the headline indices suggested, reflecting an unusual influence on the PMI from the coronavirus which has artificially boosted the numbers.
Better than expected?
Having recorded 49.1 in March, the ISM headline manufacturing PMI was expected to have fallen to 36.9 in April according to the consensus forecast from Reuters polling. The actual print came in almost five points higher at 41.5, suggesting the manufacturing downturn had not been as severe as the majority had been expecting. The earlier flash PMI from IHS Markit had likewise come in higher than widely anticipated.
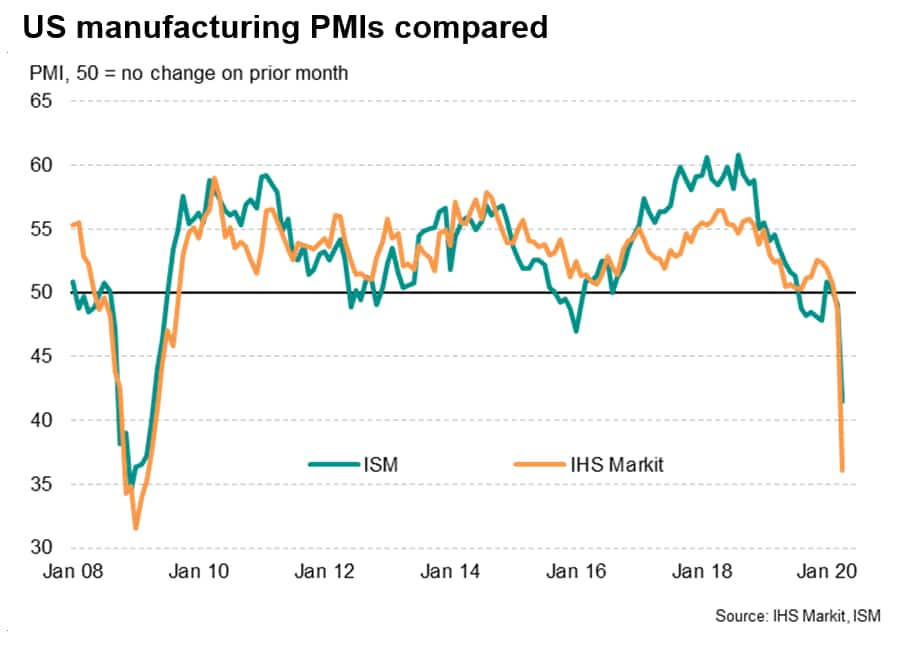
At face value, both indicators are suggesting that the current downturn in manufacturing is not as severe as the global financial crisis (GFC).
However, this is not the case. The inclusion of supplier delivery times as a component of the headline PMI for both surveys has led to these indicators understating the actual collapse of manufacturing production during the month.
Delivery delays are normally a sign of a growing economy
The headline PMI figures are composite indicators derived from five survey variables relating to output, new orders, employment, inventories and suppliers' delivery times. The latter measures the average time taken for suppliers to provide inputs to manufacturers to use in the production process.
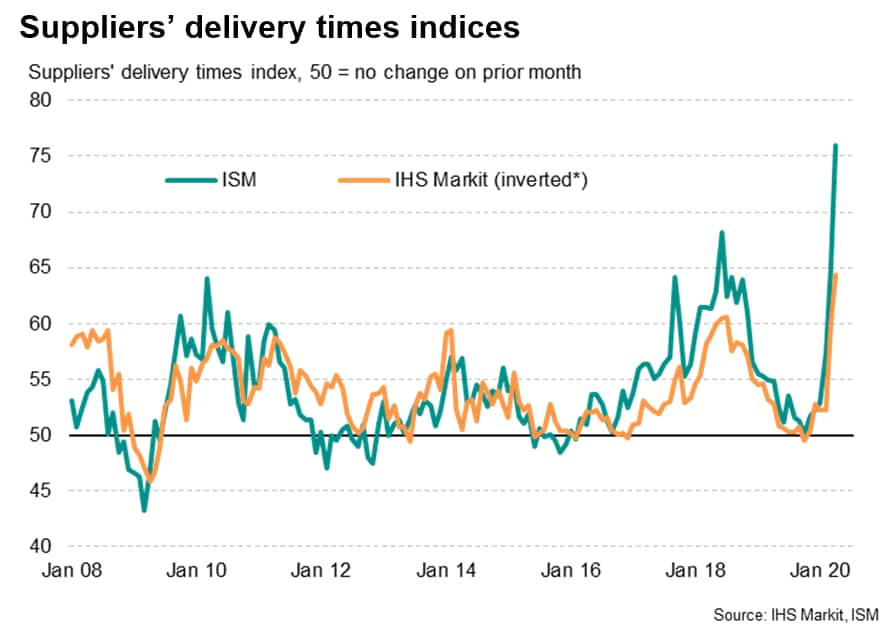
When orders for manufactured goods improve, demand for inputs rises as producers seek to make more goods. This tends to put pressure on suppliers who may not have enough stock to supply this increased demand for inputs, which can vary from nuts and bolts, basic food ingredients and other commodities right through to complex components such as engines and gearboxes to be fitted into vehicles. These delivery delays are therefore usually symptomatic of an economy that is growing strongly.
For this reason, in most cases the suppliers' delivery times index moves in a similar cycle to other PMI components such as output, new orders and employment. Improvements in all of these variables tend to be indicative of an economy growing. This was the case, for example, during much of 2018, when surging demand led to a marked lengthening of suppliers' delivery times, which boosted the PMI accordingly, in line with the other PMI constituents.
Conversely, when demand falls, manufacturers cut back on their purchasing of inputs. Suppliers are often left with unsold stock and can consequently deliver new inputs straight off the shelf to manufacturers. Periods of slumping demand and reduced production therefore generally see faster (shorter) delivery times. Such a scenario was evident during the global financial crisis of 2008-9, when quicker delivery times acted as a drag on the PMI.
This time it's different
This time it's different, however, as delivery delays and longer delivery times are not occurring because demand has strengthened. Instead, since February 2020, when a large proportion of China's factories shut down for an extended lunar new year holiday to prevent the spread of COVID-19, supply chain delays have become widespread as suppliers have simply not been making and shipping goods.
In other words, recent months have seen suppliers' delivery times lengthen due to a supply shock, not because of surging demand.
This supply shock has since been exacerbated by an increasing number of other countries, including the US, introducing lockdowns to fight the pandemic. The lengthening of suppliers' delivery times in the IHS Markit US manufacturing PMI in April was consequently the longest in the survey's history, exceeding that seen even at the height of the global financial crisis. A similar marked lengthening was seen in the ISM delivery times gauge, where delays were the most widespread since 1979.
Artificial boost
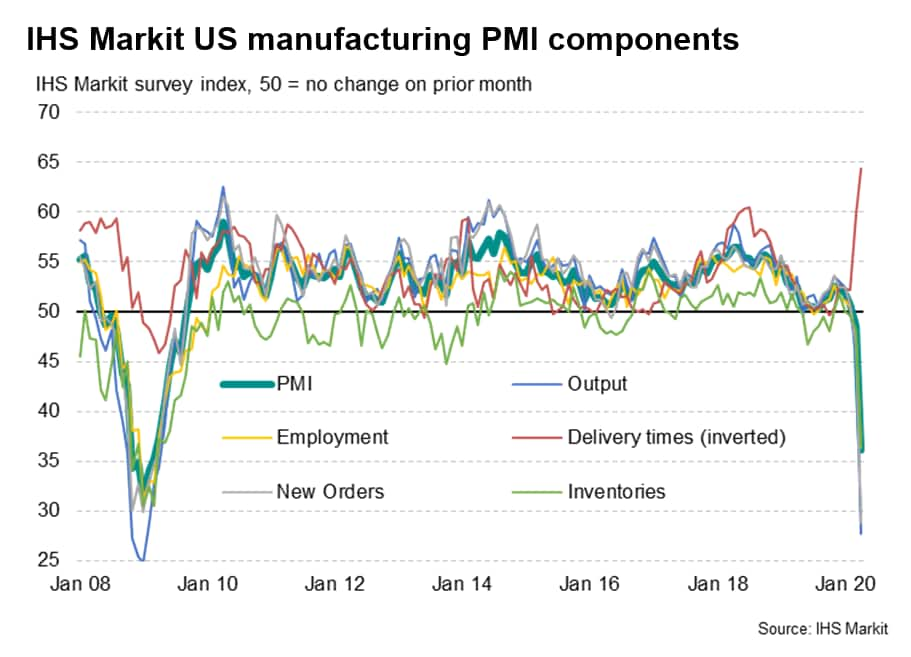
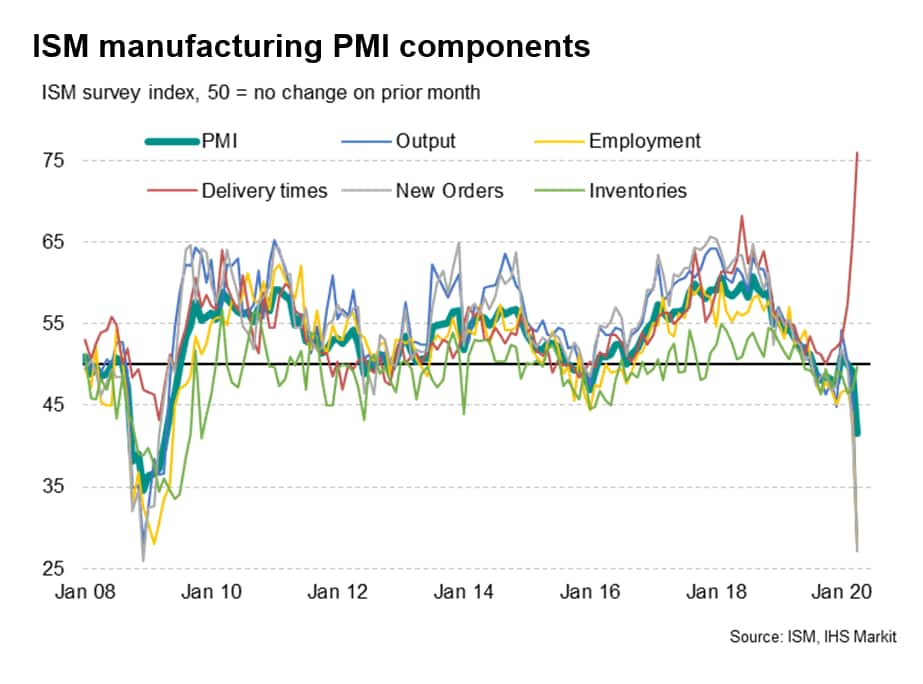
The resulting impact of supply delays on the headline PMI can be seen by charting the PMIs from the two surveys and their five components. Both ISM and IHS Markit surveys show that the lengthening of delivery times is counter to what we would normally expect to see at a time of slumping order books and falling production. This therefore represents an 'artificial' boost to the headline PMIs from the supplier delivery times index.
As such, the headline PMI figures are understating the decline in manufacturing resulting from the coronavirus outbreak. This is clearly evident by the extent to which both output and new orders are falling compared to the headline PMIs in both surveys.
If you want to know what's happening to production look at the output index
To get a more accurate handle on the extent to which manufacturing is really being affected by the coronavirus, it makes sense to look at the output index.
In fact, we would recommend that analysts should always favour the output (and new orders) index as the best indicator of manufacturing production trends, as the signal from the headline PMI can easily be distorted and blurred by changes in hiring (typically a lagging indicator) or inventories as well as supply shocks causing delivery delays
A rate of decline worse than the GFC
If we look purely at the output indices from the two surveys, we can see that rates of decline have in fact now exceeded those recorded during the height of the GFC in both cases.
Both output indices are highly correlated with the official data on manufacturing production. Looking at the last 11 years for which comparable data are available and using a three-month-on-three-month rate of change in the official data (compiled by the Fed), the ISM output index display a correlation of 79%, though the IHS Markit's correlation is substantially higher at 89%.
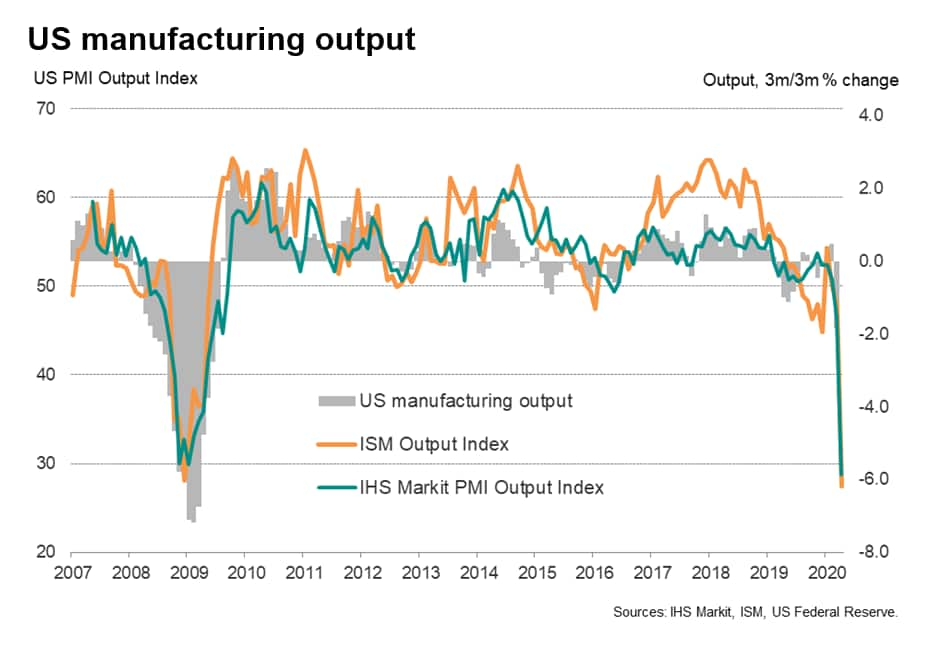
The higher correlation of the IHS Markit PMI against official production data can potentially be explained by historical differences in methodologies, notably in survey panel design, sample sizes and inclusion of smaller companies in the IHS Markit survey, which is investigated more fully in our prior paper available here.
For more information contact economics@ihsmarkit.com.
Chris Williamson, Chief Business Economist, IHS
Markit
Tel: +44 207 260 2329
chris.williamson@ihsmarkit.com
© 2020, IHS Markit Inc. All rights reserved. Reproduction in whole or in part without permission is prohibited.
Purchasing Managers' Index™ (PMI™) data are compiled by IHS Markit for more than 40 economies worldwide. The monthly data are derived from surveys of senior executives at private sector companies, and are available only via subscription. The PMI dataset features a headline number, which indicates the overall health of an economy, and sub-indices, which provide insights into other key economic drivers such as GDP, inflation, exports, capacity utilization, employment and inventories. The PMI data are used by financial and corporate professionals to better understand where economies and markets are headed, and to uncover opportunities.
This article was published by S&P Global Market Intelligence and not by S&P Global Ratings, which is a separately managed division of S&P Global.
{"items" : [
{"name":"share","enabled":true,"desc":"<strong>Share</strong>","mobdesc":"Share","options":[ {"name":"facebook","url":"https://www.facebook.com/sharer.php?u=http%3a%2f%2fprod.azure.ihsmarkit.com%2fmarketintelligence%2fen%2fmi%2fresearch-analysis%2funderstanding-us-manufacturing-pmis-and-supplier-shortages-may20.html","enabled":true},{"name":"twitter","url":"https://twitter.com/intent/tweet?url=http%3a%2f%2fprod.azure.ihsmarkit.com%2fmarketintelligence%2fen%2fmi%2fresearch-analysis%2funderstanding-us-manufacturing-pmis-and-supplier-shortages-may20.html&text=Understanding+US+manufacturing+PMIs%2c+and+how+supplier+shortages+are+giving+an+artificial+boost+to+the+PMI+amid+the+coronavirus+outbreak+%7c+S%26P+Global+","enabled":true},{"name":"linkedin","url":"https://www.linkedin.com/sharing/share-offsite/?url=http%3a%2f%2fprod.azure.ihsmarkit.com%2fmarketintelligence%2fen%2fmi%2fresearch-analysis%2funderstanding-us-manufacturing-pmis-and-supplier-shortages-may20.html","enabled":true},{"name":"email","url":"?subject=Understanding US manufacturing PMIs, and how supplier shortages are giving an artificial boost to the PMI amid the coronavirus outbreak | S&P Global &body=http%3a%2f%2fprod.azure.ihsmarkit.com%2fmarketintelligence%2fen%2fmi%2fresearch-analysis%2funderstanding-us-manufacturing-pmis-and-supplier-shortages-may20.html","enabled":true},{"name":"whatsapp","url":"https://api.whatsapp.com/send?text=Understanding+US+manufacturing+PMIs%2c+and+how+supplier+shortages+are+giving+an+artificial+boost+to+the+PMI+amid+the+coronavirus+outbreak+%7c+S%26P+Global+ http%3a%2f%2fprod.azure.ihsmarkit.com%2fmarketintelligence%2fen%2fmi%2fresearch-analysis%2funderstanding-us-manufacturing-pmis-and-supplier-shortages-may20.html","enabled":true}]}, {"name":"rtt","enabled":true,"mobdesc":"Top"}
]}


