Customer Logins
Obtain the data you need to make the most informed decisions by accessing our extensive portfolio of information, analytics, and expertise. Sign in to the product or service center of your choice.
Customer Logins
EQUITIES COMMENTARY
Aug 06, 2020
Securities Finance: 2020 mid-year review
- H1 revenues decline 4.8% YoY
- US equity special balances soar
- Reinvestment return declining from late-March peak
Global securities lending returns in the first half of 2020 fell by 4.8% YoY. The utilization of lendable assets remains elevated YoY in aggregate as well as for most asset classes, despite declining from the YTD peak in March. The top-level changes belie a variety of asset class and region-specific dynamics which we'll discuss in this note. Increasing demand for US equity specials, US Treasuries and global ETFs drove increased returns for those asset classes. The revenue shortfall was caused by declining balances and fees for non-US equities, ADRs & corporate bonds, however it's worth bearing in mind that average H1 total return to lendable for all securities increased YoY based on reinvestment contribution.
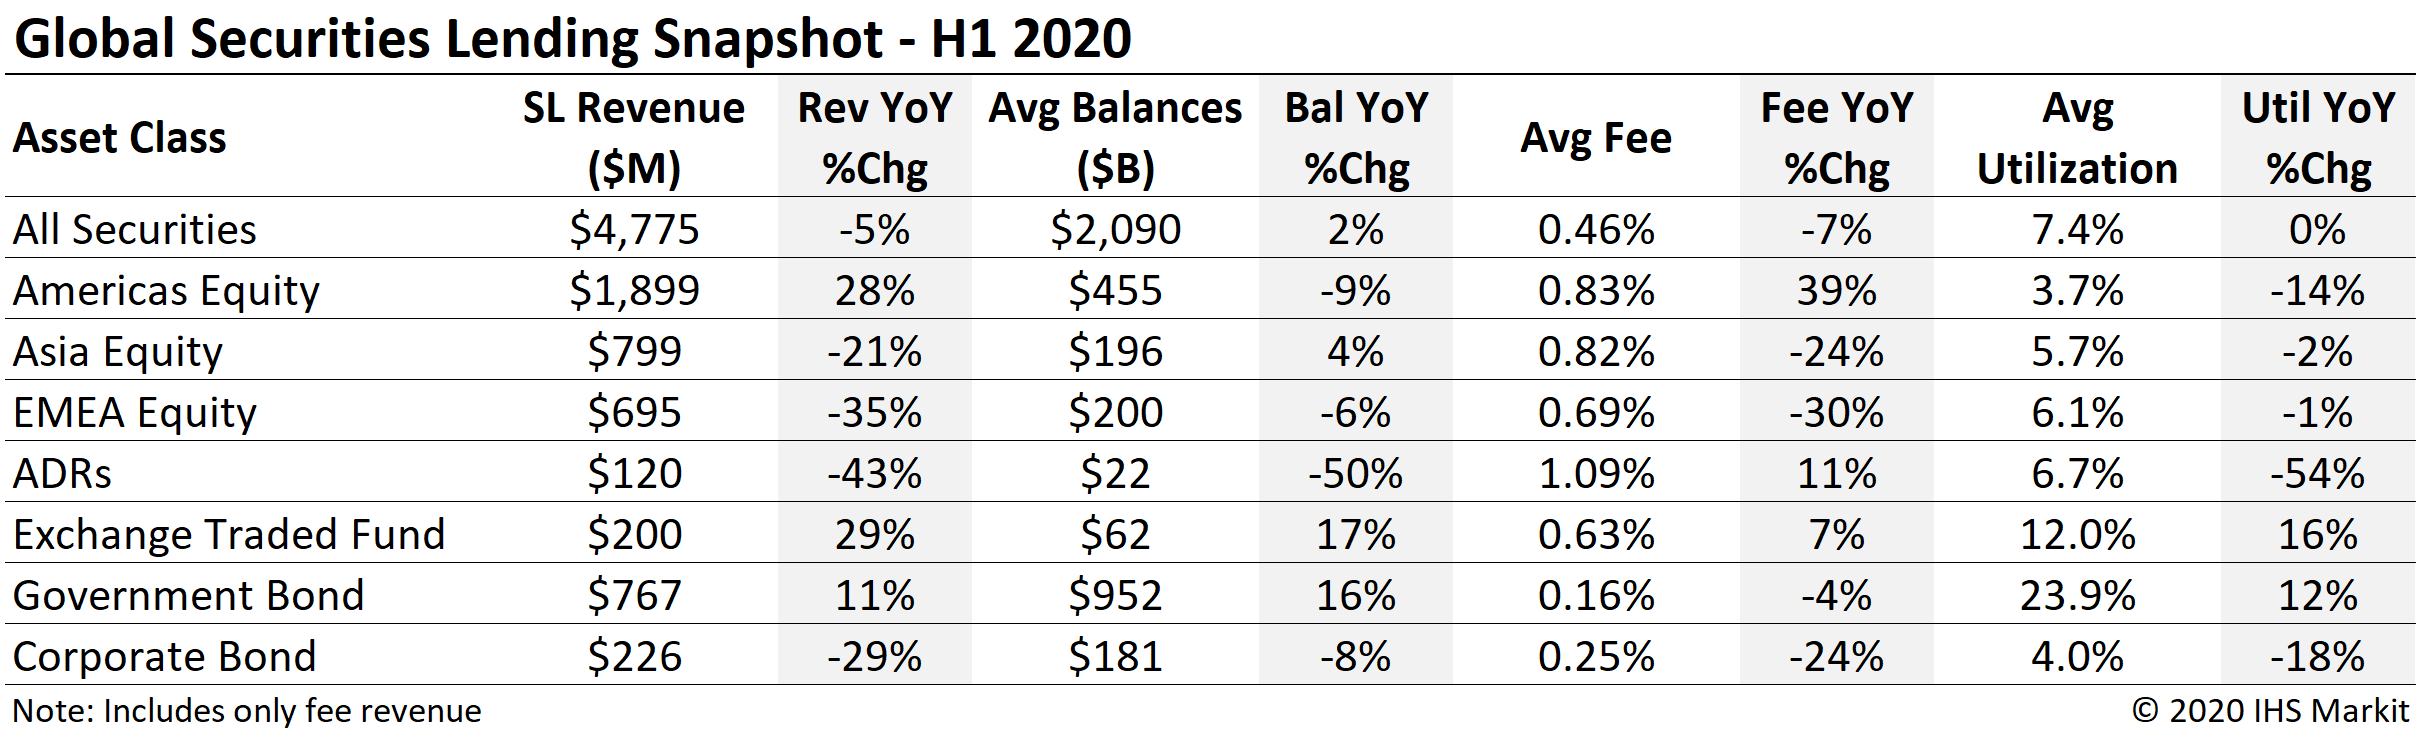
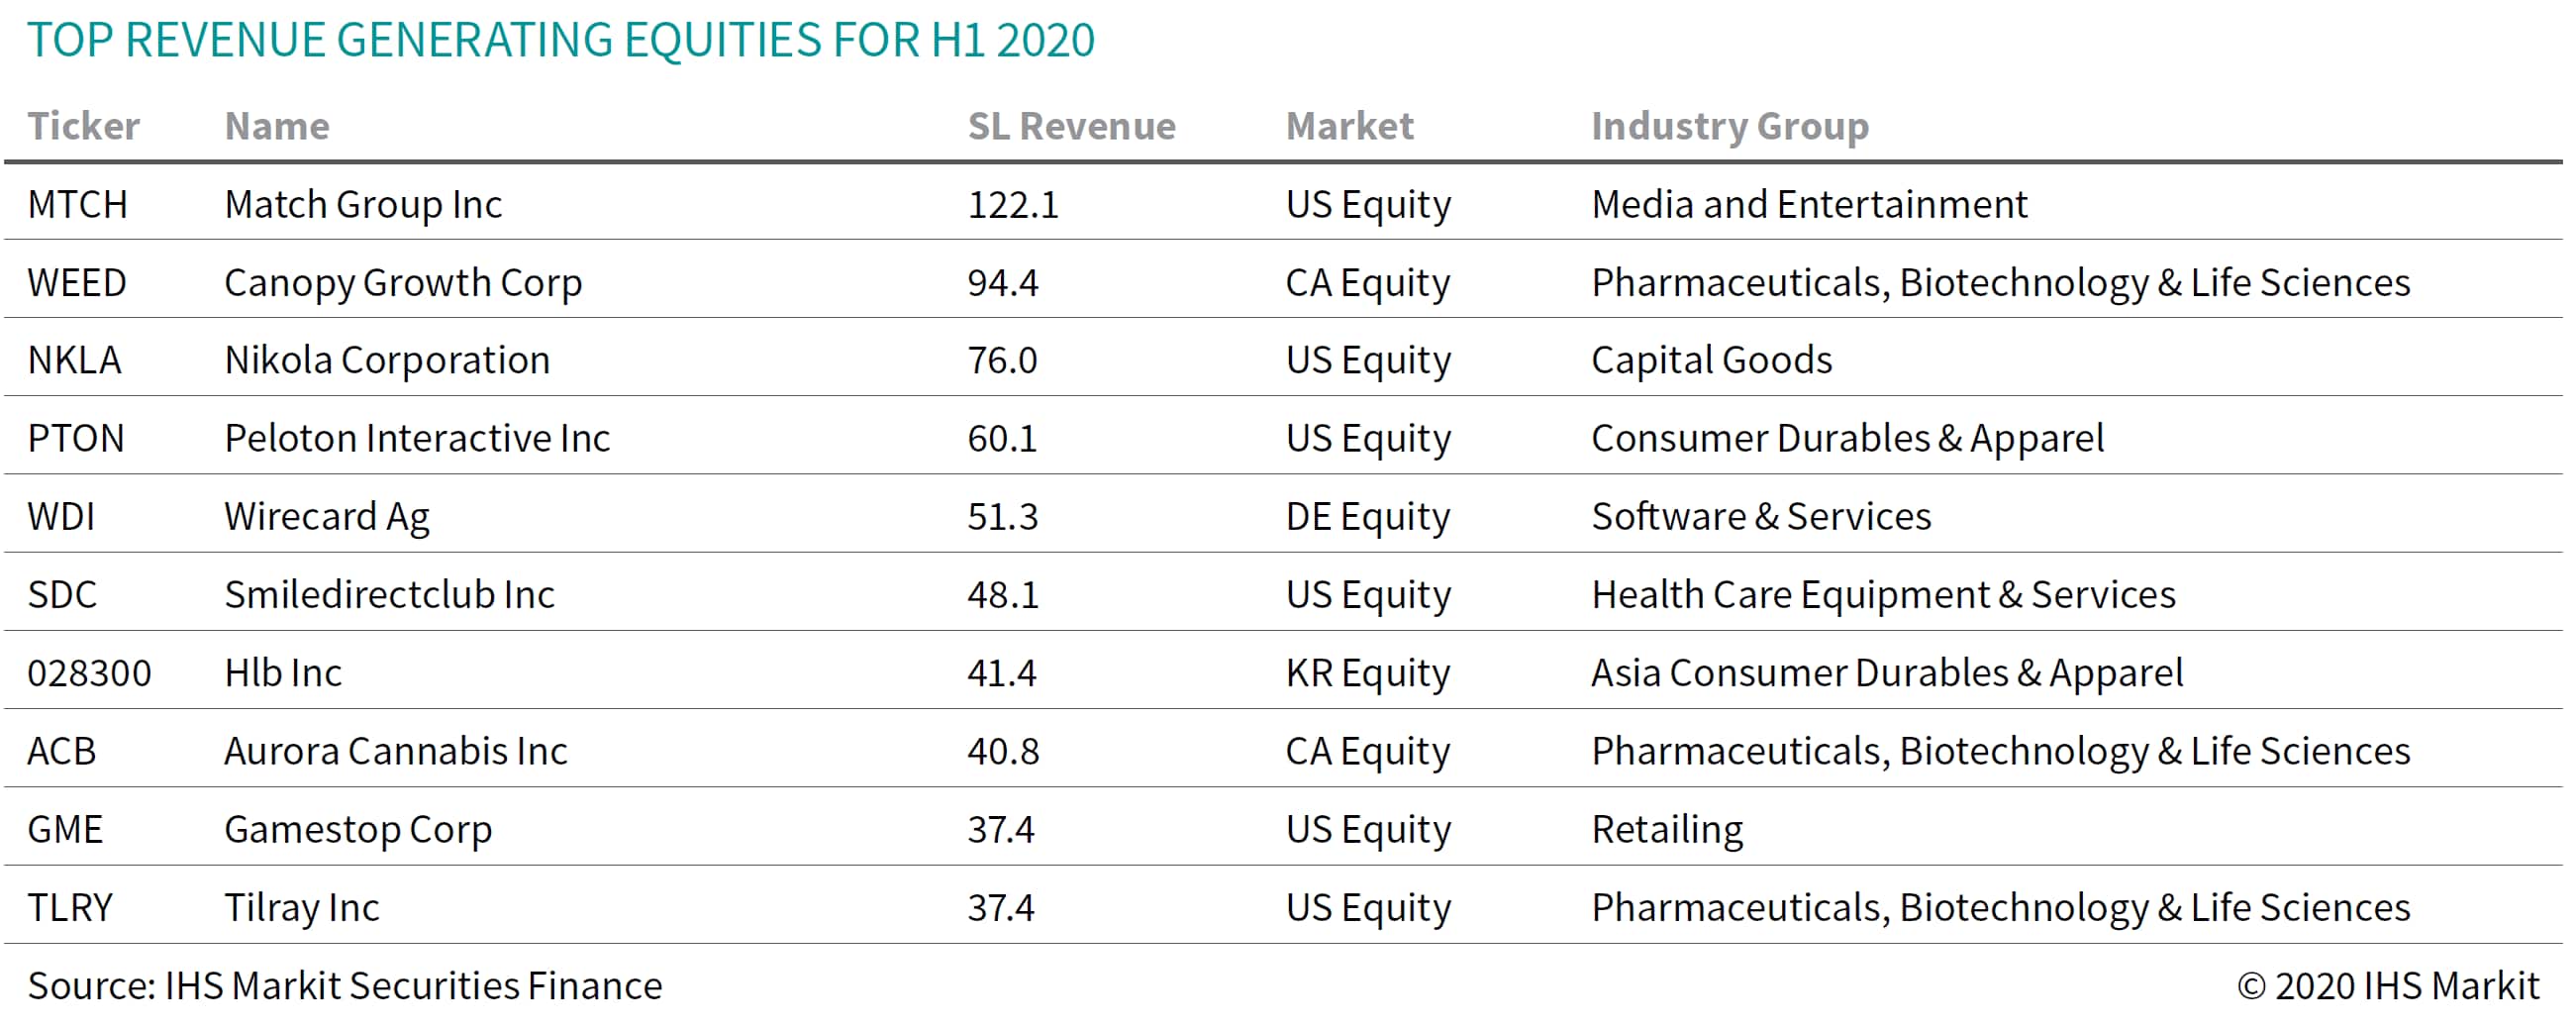
US equity revenues came in at $1.6bn for the first half of 2020, an increase of 35% YoY. The revenue increase was driven by a 46% YoY increase in weighted average fees, which more than offset the 8.4% reduction in average YTD balances. The broad short squeeze in hard-to-borrow shares, particularly in April and early June, had the knock-on impact of increasing special balances broadly. Drivers of the upswing in US equity specials include arbitrage trades relating to convertible bonds, SPAC IPOs and exchange offers as well as increased trading of shares in firms which facing potential bankruptcy.
Canadian equity lending revenues increased sequentially from May to June, however returns are still lower than they were in 2019, which has been true for each month of 2020 starting in March. Canadian equities had $279m in H1 2020 revenues, a 2.8% YoY decline.
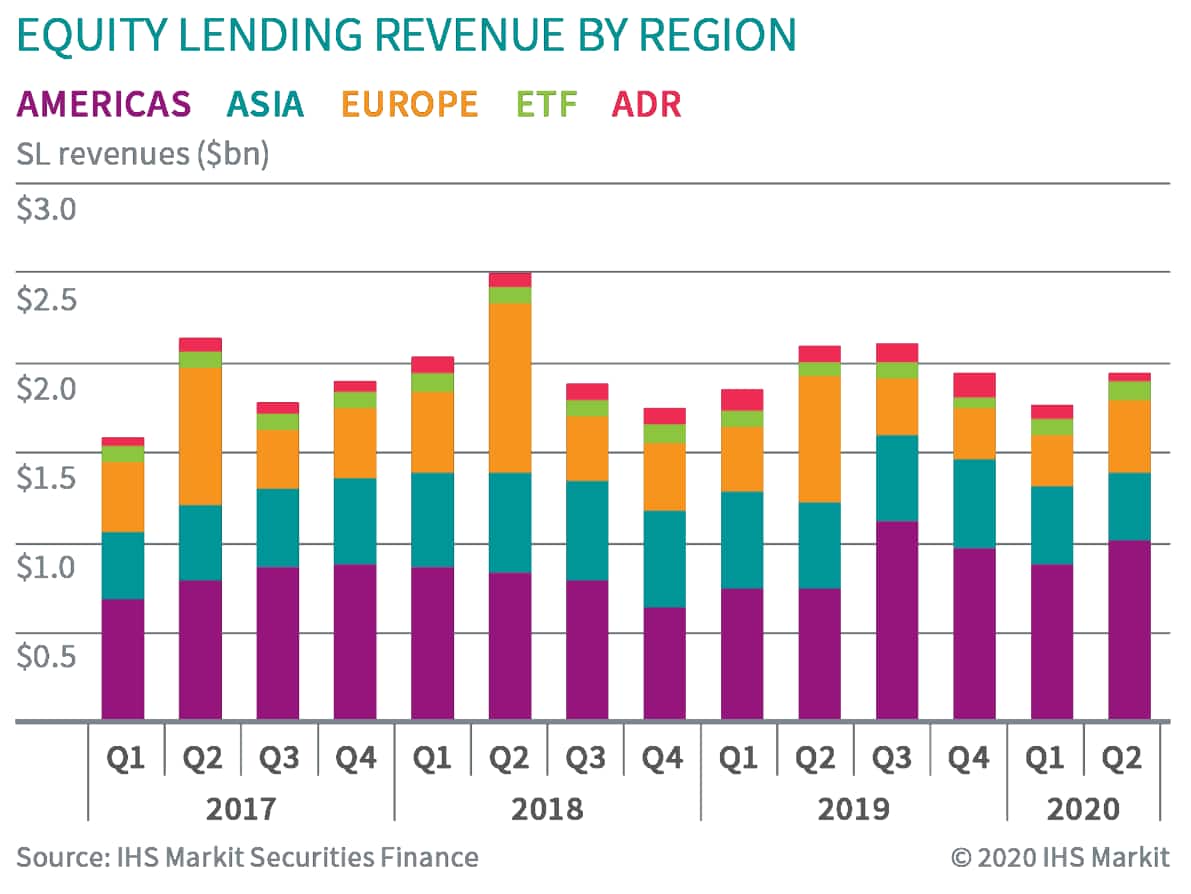
Equity lending in Europe has fallen well short of 2019 returns, with revenues of $695m reflecting a 35% YoY decline. As the Wirecard story descended into scandal, the limited availability of shares in lending programs pushed up on fees resulting in the equity delivering $37m in YTD revenue, or 5% of all European equity lending returns. Dividend delays complicate the YoY comparison, which will become clearer this summer.
Asia equity lending revenues remain subdued compared with prior years; H1 2020 revenues of $798m reflect a 21% YoY decline. The largest market, Japan, delivered H1 revenues of $303m, a 24% decline compared with the first half of 2019. The short sale ban in South Korea has limited lending revenue and equity lending revenues for H1 totalled $169m, a 20% YoY decline. Hong Kong equity lending revenues picked up in May and June, however the Q1 shortfall meant H1 total fell 20% YoY. Australian equity revenues totalled $44m in H1, a 29% YoY decline.
Global ETF revenues were $200m for H1, a 29% YoY increase. ETF lending revenues soared in March, with $53m in monthly revenue, more than double the March 2019 total after falling short of YoY comparison in January and February; Q2 monthly returns were consistently between $32 to $36m per month. Most ETF lending metrics peaked in March and declined thereafter but remain well above the January and February observations (including revenues, balances, fees and utilization).
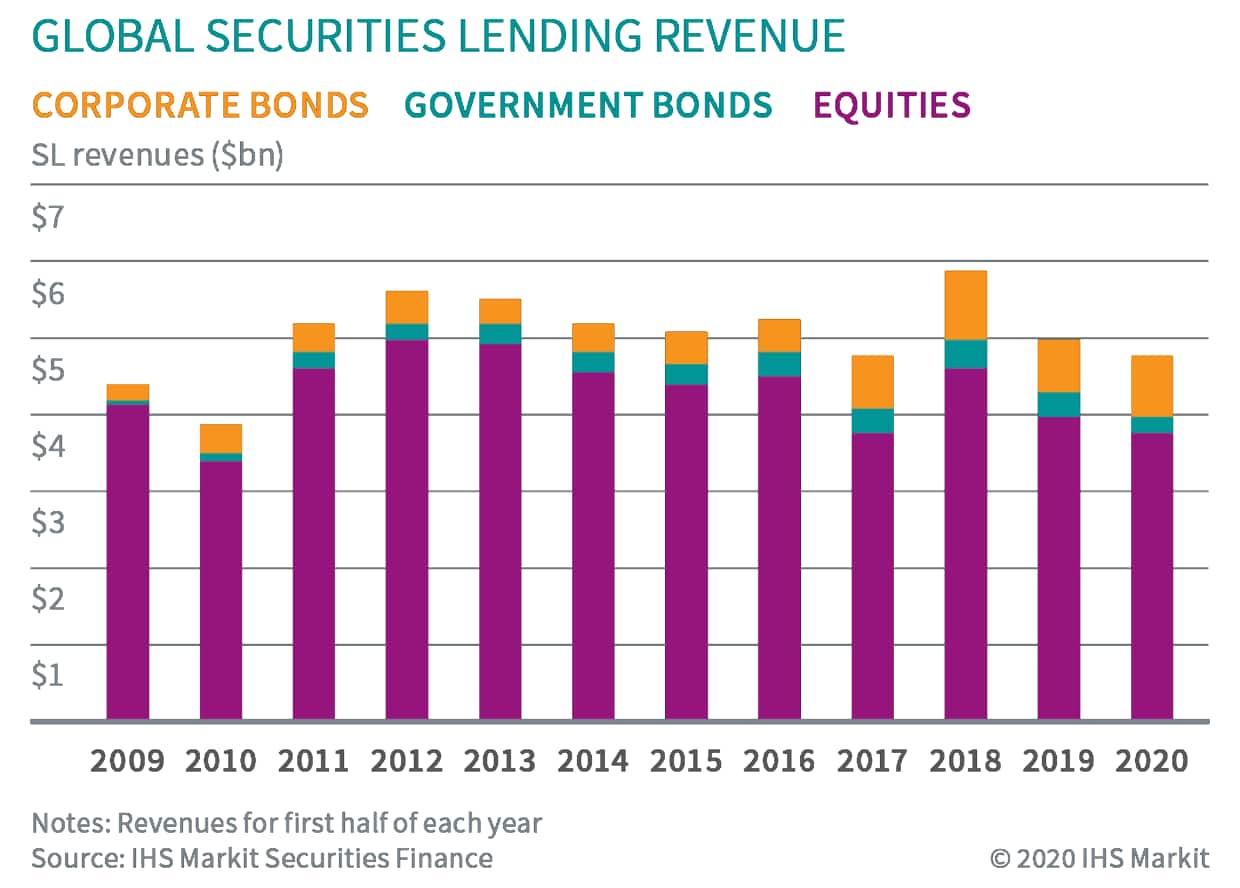
Fee-based revenue for government bond lending came in at $766m for H1, an 11% YoY increase resulting from larger loan balances; H1 average fees declined YoY as a function of falling short in January and February. US Treasuries returned $468m for H1, a 29% increase. For beneficial owners, returns from lending US Treasury securities in 2020 have been substantially bolstered by reinvestment of cash collateral, however reinvestment returns have steadily trended lower since late March. Returns from lending European sovereigns were $228m for H1, an 12% YoY decline as the result of both lower balances and fees, though spreads did widen in April and May which helped to offset declining balances.
Corporate bond lending revenues continue to fall short of 2019 levels, mostly as the result of declining fees, however balances have also declined YoY. H1 corporate lending returns came in at $226m, a 29% decline YoY.
Conclusion:
Short sale bans, central bank support for credit and dividend cuts have dampened borrow demand in the first half of 2020. US equity specials are leading the way into the 2nd half of the year, where the asset class runs into a much more challenging YoY comparison. The increased popularity of retail trading has reinforced the importance of that supply of hard to borrow shares, however utilization and return to lendable are trending upward for agency lending of US equities as well. Challenges and opportunities abound heading into the second half of the year, close monitoring of results is warranted.
We hosted a webinar on July 9th to discuss broad market trends, recording available now via registration link.
S&P Global provides industry-leading data, software and technology platforms and managed services to tackle some of the most difficult challenges in financial markets. We help our customers better understand complicated markets, reduce risk, operate more efficiently and comply with financial regulation.
This article was published by S&P Global Market Intelligence and not by S&P Global Ratings, which is a separately managed division of S&P Global.
{"items" : [
{"name":"share","enabled":true,"desc":"<strong>Share</strong>","mobdesc":"Share","options":[ {"name":"facebook","url":"https://www.facebook.com/sharer.php?u=http%3a%2f%2fprod.azure.ihsmarkit.com%2fmarketintelligence%2fen%2fmi%2fresearch-analysis%2fsecurities-finance-snapshot.html","enabled":true},{"name":"twitter","url":"https://twitter.com/intent/tweet?url=http%3a%2f%2fprod.azure.ihsmarkit.com%2fmarketintelligence%2fen%2fmi%2fresearch-analysis%2fsecurities-finance-snapshot.html&text=Securities+Finance%3a+2020+mid-year+review+%7c+S%26P+Global+","enabled":true},{"name":"linkedin","url":"https://www.linkedin.com/sharing/share-offsite/?url=http%3a%2f%2fprod.azure.ihsmarkit.com%2fmarketintelligence%2fen%2fmi%2fresearch-analysis%2fsecurities-finance-snapshot.html","enabled":true},{"name":"email","url":"?subject=Securities Finance: 2020 mid-year review | S&P Global &body=http%3a%2f%2fprod.azure.ihsmarkit.com%2fmarketintelligence%2fen%2fmi%2fresearch-analysis%2fsecurities-finance-snapshot.html","enabled":true},{"name":"whatsapp","url":"https://api.whatsapp.com/send?text=Securities+Finance%3a+2020+mid-year+review+%7c+S%26P+Global+ http%3a%2f%2fprod.azure.ihsmarkit.com%2fmarketintelligence%2fen%2fmi%2fresearch-analysis%2fsecurities-finance-snapshot.html","enabled":true}]}, {"name":"rtt","enabled":true,"mobdesc":"Top"}
]}