Customer Logins
Obtain the data you need to make the most informed decisions by accessing our extensive portfolio of information, analytics, and expertise. Sign in to the product or service center of your choice.
Customer Logins
ECONOMICS COMMENTARY
Feb 17, 2021
IHS Markit PMI and CIS data pairing provides key strategic insights
- IHS Markit PMI and CIS data pairing provides key strategic insights
- Comprehensive sector and regional coverage
- Short- and long-term developments monitored through monthly PMI updates and quarterly/ annual CIS forecasts
IHS Markit is introducing a new product offering in the form of combined expertise from our PMI™ and CIS (Comparative Industry Service) teams. By providing both up-to-the-moment data through the monthly PMI releases, and medium-to-long term forecasts via the CIS team, we are better able to support businesses through strategic and tactical decisions. The ability to isolate sectors by region and end market has broadened the range of information we can use to identify current and future trends in sectors.
With a potential crossover for numerous region-sector pairings covering Global, Europe, Asia and US data, we are able to provide monthly, quarterly and annual data to aide business decisions such as; identifying turning points in client demand in end markets, where to plan investment over the coming years, insights into supply chain management and, importantly, how long it will take specific economies and sectors to recover from economic shocks.
CIS forecasts and PMI data working in tandem
PMI data and forecasts modelled by the CIS team have long been working together to provide key insights into industrial production and output when official data is unavailable. Near-term data is published at the start of each month and provides firms with not only an outlook for the coming quarter, but also greater detail on emerging trends in sectoral performance. Being able to identify turning points in vendor performance and new order inflows across regions and sectors can be vital information when considering where to invest and how to safeguard against supply-chain shocks.
The provision of up-to-the-moment data during times of increased uncertainty and instability is invaluable, with greater knowledge helping to ensure considered and balanced approaches to significant investment or operational decisions.
PMI data identifies turning points
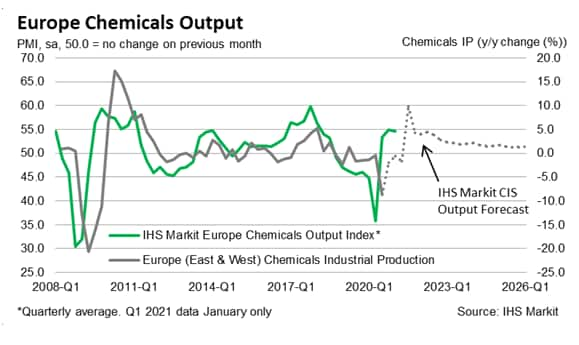
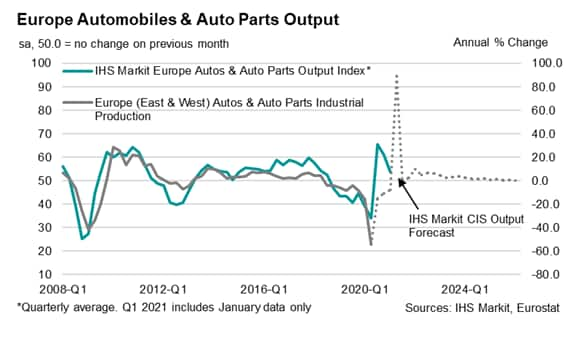
When looking to examples of the two datasets working in tandem, we largely focus on the CISQ dataset. This is a quarterly release of an industrial production index, fusing together historical official data and the latest CIS sector forecast. The close relationship between PMI and historical official data lends itself to such a comparison. The complementary nature of the PMI and CIS data sets can also be seen through the lens of the different sources of the data. PMI from unique surveys and CIS from official national accounts data. When data from both of these very different sources is pointing in the same direction, they send very powerful signals in relation to sector performance.
As we can see from examples in the chemicals and automotive industry, the inclusion of PMI data in any analysis can quickly help identify the speed at which the sectoral landscape is changing, and therefore allow businesses to adapt their plans in real time.
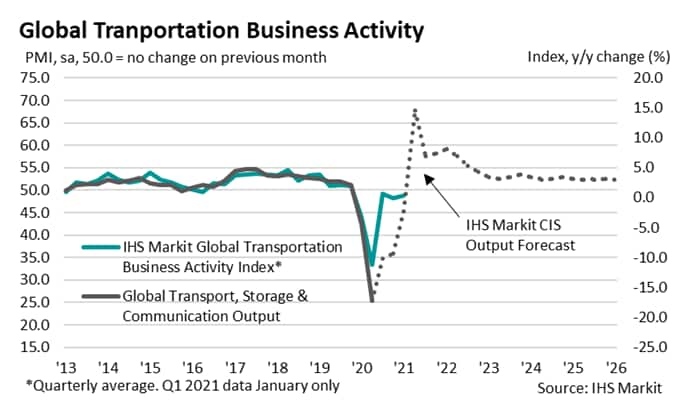
The impact of such assessment is not limited to the manufacturing sector, however. During the pandemic, the service sector has been hit hard and this has been seen time and time again in national and PMI data by sector. The impact on consumer-facing businesses has been marked, but also industries which rely upon the movement of goods and people. The transportation sector saw a significant decline during the depths of the initial lockdown period in the spring of 2020 and began to gradually move towards recovery in the latter stages of the year. That said, the Global Transportation Business Activity Index only went above the 50.0 no change mark twice in 2020, once in January and a second time in November, with the recovery plateauing in January 2021.

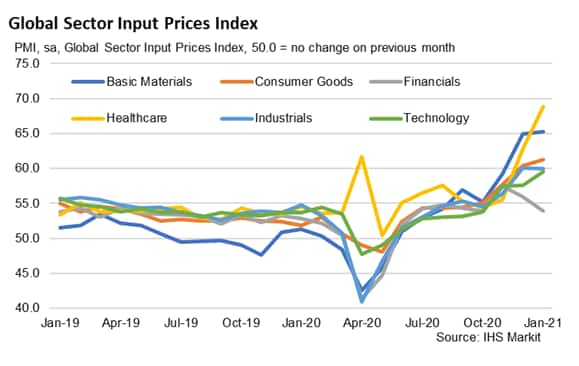
Real-time changes in business activity trends are by no means the only signals PMI data can pick up. Recent supply-chain shocks have been indicated through significant deteriorations in vendor performance, but also substantial increases in input costs. Although all monitored sectors saw an increase in cost burdens in the latter stages of 2020, the pace of such price rises varied greatly. By analysing the rate of input price inflation, and noting the point at which firms in individual sectors are able to pass on higher costs to clients, we can better understand demand conditions, business confidence and the stability of cash flow, all of which will have a profound effect on investment and production decisions going forward.
In an ever-changing time of virus restrictions and lockdown measures, it is crucial that forecasts and data provision utilise the most up-to-date data such that businesses can make informed decisions. The impact of lockdowns has been wide-reaching and significant, with monthly data helping identify what this snapshot means in the near-term as well as any changes this may bring to forecasts.
Siân Jones, Senior Economist, IHS Markit
Tel: +44 1491 461017
sian.jones@ihsmarkit.com
© 2021, IHS Markit Inc. All rights reserved. Reproduction in whole or in part without permission is prohibited.
Purchasing Managers' Index™ (PMI™) data are compiled by IHS Markit for more than 40 economies worldwide. The monthly data are derived from surveys of senior executives at private sector companies, and are available only via subscription. The PMI dataset features a headline number, which indicates the overall health of an economy, and sub-indices, which provide insights into other key economic drivers such as GDP, inflation, exports, capacity utilization, employment and inventories. The PMI data are used by financial and corporate professionals to better understand where economies and markets are headed, and to uncover opportunities.
This article was published by S&P Global Market Intelligence and not by S&P Global Ratings, which is a separately managed division of S&P Global.
{"items" : [
{"name":"share","enabled":true,"desc":"<strong>Share</strong>","mobdesc":"Share","options":[ {"name":"facebook","url":"https://www.facebook.com/sharer.php?u=http%3a%2f%2fprod.azure.ihsmarkit.com%2fmarketintelligence%2fen%2fmi%2fresearch-analysis%2fihs-markit-pmi-and-cis-data-pairing-provides-key-strategic-insights-Feb21.html","enabled":true},{"name":"twitter","url":"https://twitter.com/intent/tweet?url=http%3a%2f%2fprod.azure.ihsmarkit.com%2fmarketintelligence%2fen%2fmi%2fresearch-analysis%2fihs-markit-pmi-and-cis-data-pairing-provides-key-strategic-insights-Feb21.html&text=S%26P+Global+PMI+and+CIS+data+pairing+provides+key+strategic+insights+%7c+S%26P+Global+","enabled":true},{"name":"linkedin","url":"https://www.linkedin.com/sharing/share-offsite/?url=http%3a%2f%2fprod.azure.ihsmarkit.com%2fmarketintelligence%2fen%2fmi%2fresearch-analysis%2fihs-markit-pmi-and-cis-data-pairing-provides-key-strategic-insights-Feb21.html","enabled":true},{"name":"email","url":"?subject=S&P Global PMI and CIS data pairing provides key strategic insights | S&P Global &body=http%3a%2f%2fprod.azure.ihsmarkit.com%2fmarketintelligence%2fen%2fmi%2fresearch-analysis%2fihs-markit-pmi-and-cis-data-pairing-provides-key-strategic-insights-Feb21.html","enabled":true},{"name":"whatsapp","url":"https://api.whatsapp.com/send?text=S%26P+Global+PMI+and+CIS+data+pairing+provides+key+strategic+insights+%7c+S%26P+Global+ http%3a%2f%2fprod.azure.ihsmarkit.com%2fmarketintelligence%2fen%2fmi%2fresearch-analysis%2fihs-markit-pmi-and-cis-data-pairing-provides-key-strategic-insights-Feb21.html","enabled":true}]}, {"name":"rtt","enabled":true,"mobdesc":"Top"}
]}


