Customer Logins
Obtain the data you need to make the most informed decisions by accessing our extensive portfolio of information, analytics, and expertise. Sign in to the product or service center of your choice.
Customer Logins
BLOG
Sep 12, 2024
Halloween supply chain activity booms
Learn more about our data and insights
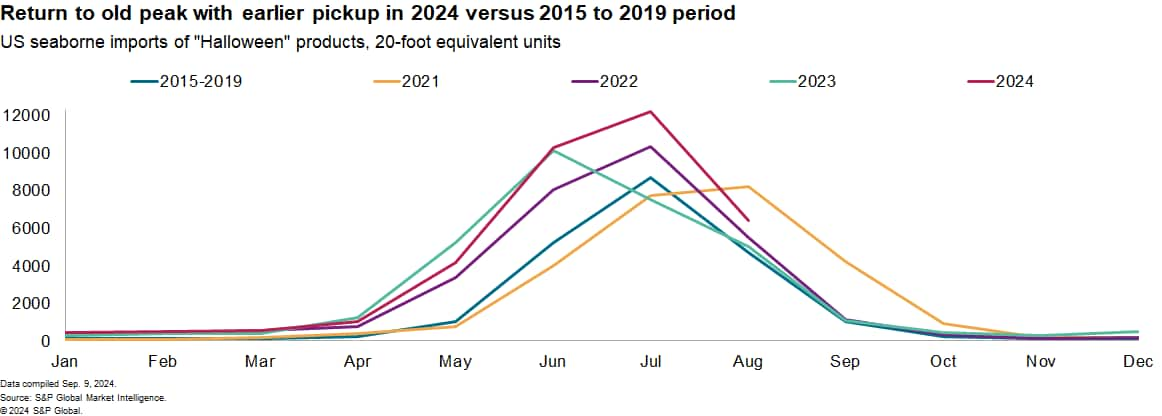
Halloween supply chain activity in the US reached a record high in 2024. Imports of related products rose by 18.6% year over year to 33,098 twenty-foot equivalent units (TEUs) of container freight. US consumer spending during the "back to school" season, which covers July through September and includes Halloween-related spending, is forecast to improve by 3.6% year over year in 2024.
Early shipping has played its part as shippers worry about logistics network disruptions. The peak season for US seaborne imports to meet Halloween product demand peaks in May through August each year. In 2024, shipments in the four-month period rose by 18.6% year over year with the 33,098 TEUs of shipments being the most for the period since at least 2007. The peak in shipments in 2024 occurred in July compared with June in 2023. In prior years, July has been the peak month.

The data shows a larger expansion in volumes earlier in the year compared with the 2015 to 2019 period. That would suggest a front-end loading into the May and June period in 2024 compared with recent history.
Hear Chris talk about back-to-school supply chain activity
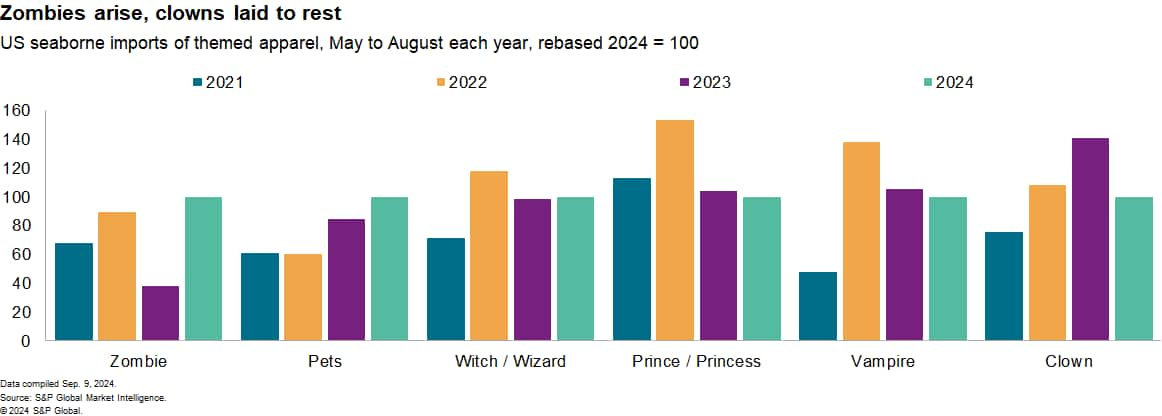
Clowns are down
In 2024, spending appears to be directed more toward decorations, with imports that rose by 20.5% year over year in the May to August period.
Outfits overall dropped by 19.4%. Among traditional themes, there was a marked rebound in "zombie" themed outfits, which expanded by more than doubled year over year. "Pets" improved by 18%. Thankfully, clown-related outfits fell out of favor after a resurgence in 2023 with a drop of 29%.

Among movie-themed outfits, Marvel-franchise products climbed 34% higher year over year thanks to the "Deadpool & Wolverine" release, while the absence of Star Wars themes led to a third annual drop in related shipments. The exception to the rule has been "Frozen," with a 29% improvement despite an absence of new films, though shipments remain below prior years' levels.
Higher candy costs
Candy supply chains are less seasonal and less reliant on global trade in terms of final products. The US nonetheless imported 1.56 million metric tons of chocolate bars and sugar candy in the 12 months to July 31, 2024 - worth $7.46 billion.
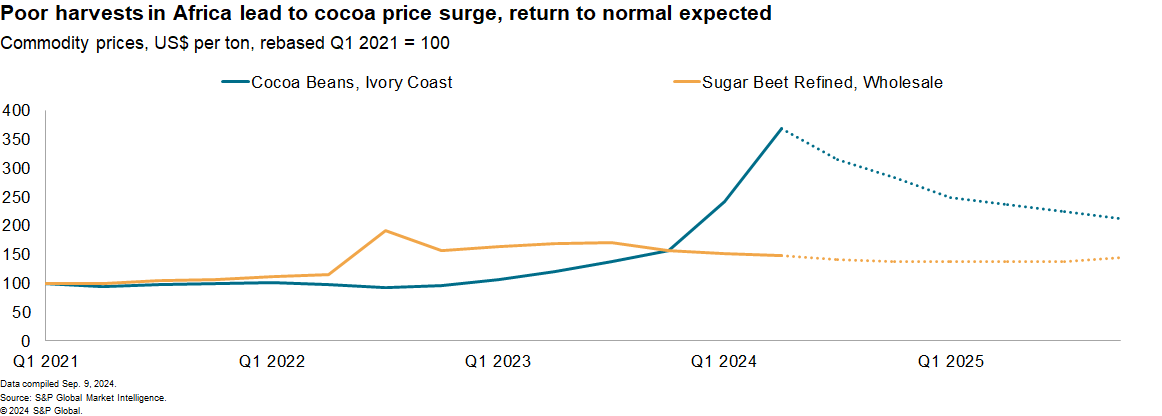
Ingredient price inflation may lead to less doorstep generosity in 2024. Poor cocoa harvests in Ivory Coast and Ghana led average chocolate bar prices to rise 9.6% year over year to $6.03 per kilogram. Including the rise in prices, imports of processed chocolate rose by 20.5% year over year in the three months to July 31, 2024.

Sugar candy imports fell by 0.6% in dollar terms, including a 5.9% drop in volumes shipped while average prices rose by 6.6% over the same period. The rise in import prices hasn't been driven by higher raw material prices, however. We estimate average wholesale refined sugar beet prices fell to $1,191 per metric ton in the second quarter of 2024 from $1,352 per metric ton a year earlier. That's been due to record tonnages harvested in Brazil.
Sign up for our Supply Chain Essentials newsletter
This article was published by S&P Global Market Intelligence and not by S&P Global Ratings, which is a separately managed division of S&P Global.
{"items" : [
{"name":"share","enabled":true,"desc":"<strong>Share</strong>","mobdesc":"Share","options":[ {"name":"facebook","url":"https://www.facebook.com/sharer.php?u=http%3a%2f%2fprod.azure.ihsmarkit.com%2fmarketintelligence%2fen%2fmi%2fresearch-analysis%2fhalloween-2024-supply-chain-activity-booms.html","enabled":true},{"name":"twitter","url":"https://twitter.com/intent/tweet?url=http%3a%2f%2fprod.azure.ihsmarkit.com%2fmarketintelligence%2fen%2fmi%2fresearch-analysis%2fhalloween-2024-supply-chain-activity-booms.html&text=Halloween+supply+chain+activity+booms+%7c+S%26P+Global+","enabled":true},{"name":"linkedin","url":"https://www.linkedin.com/sharing/share-offsite/?url=http%3a%2f%2fprod.azure.ihsmarkit.com%2fmarketintelligence%2fen%2fmi%2fresearch-analysis%2fhalloween-2024-supply-chain-activity-booms.html","enabled":true},{"name":"email","url":"?subject=Halloween supply chain activity booms | S&P Global &body=http%3a%2f%2fprod.azure.ihsmarkit.com%2fmarketintelligence%2fen%2fmi%2fresearch-analysis%2fhalloween-2024-supply-chain-activity-booms.html","enabled":true},{"name":"whatsapp","url":"https://api.whatsapp.com/send?text=Halloween+supply+chain+activity+booms+%7c+S%26P+Global+ http%3a%2f%2fprod.azure.ihsmarkit.com%2fmarketintelligence%2fen%2fmi%2fresearch-analysis%2fhalloween-2024-supply-chain-activity-booms.html","enabled":true}]}, {"name":"rtt","enabled":true,"mobdesc":"Top"}
]}


