Customer Logins
Obtain the data you need to make the most informed decisions by accessing our extensive portfolio of information, analytics, and expertise. Sign in to the product or service center of your choice.
Customer Logins
ECONOMICS COMMENTARY
Mar 23, 2022
Global manufacturers signal record increase in prices paid for energy and semiconductors in February
S&P Global PMI Commodity Price & Supply Indicators highlighted that manufacturers continued to battle against rising prices and shortages for a wide range of items in February, with the fallout from the war in Ukraine set to reverse the recent improvement in international supply chain conditions.
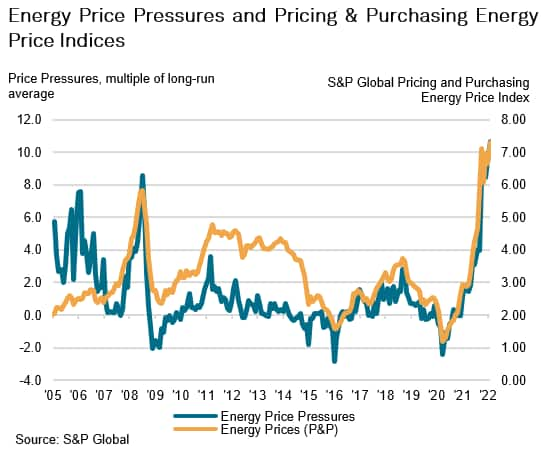
The number of manufacturers reporting rising energy costs was the highest since data were first available in January 2005, sending an early warning that escalating oil and gas prices are set to unleash another wave of inflationary pressures around the world.
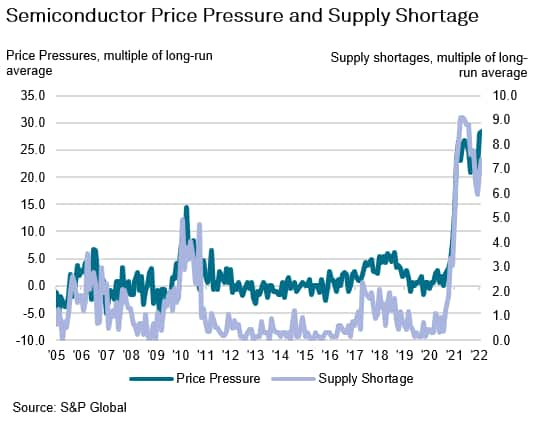
Reports citing increased energy prices were more than ten times greater than normal in February (10.6), which compared with 9.5 times greater than normal in January and exceeded the previous peak of 8.6 recorded in July 2008. Meanwhile, price pressures for semiconductors were stronger than those seen for any other item monitored in February, with this index reaching a fresh record high of 28.3.
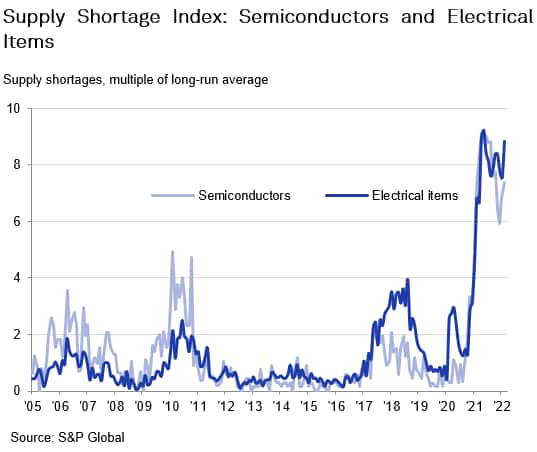
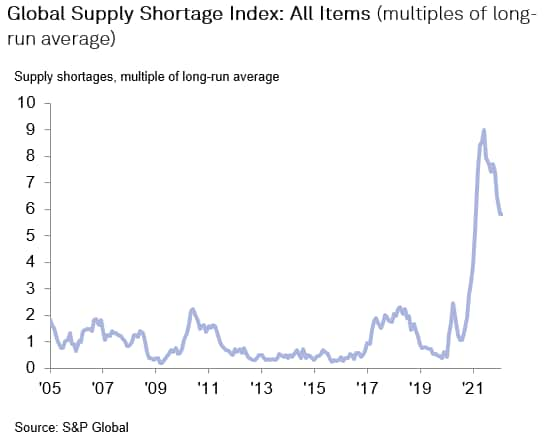
Stretched international supply chains meant that reports of supply shortages by manufacturers around the world remained 5.8 times higher than usual in February, although this was down from a peak of 9.0 in June 2021. By item, the most acute difficulties were for Transport, as delays at ports and constrained haulage capacity meant that shortages were 24.0 times higher than usual. Semiconductor shortages also remained a key concern for global manufacturers, with this index reaching a four-month high of 7.4.
S&P Global PMI Commodity Price & Supply Indicators were devised to provide timely insights into price and supply pressures for key commodities, services and product groups amid heightened concerns surrounding rising prices and material shortages. The indices are derived from the S&P Global monthly Purchasing Managers' Index™ (PMI) business surveys for the manufacturing sector, which cover variables such as output, new orders, purchase prices and suppliers' delivery times, with monthly data collected from approximately 10,000 companies worldwide.
Index measuring prices paid for energy hits record high
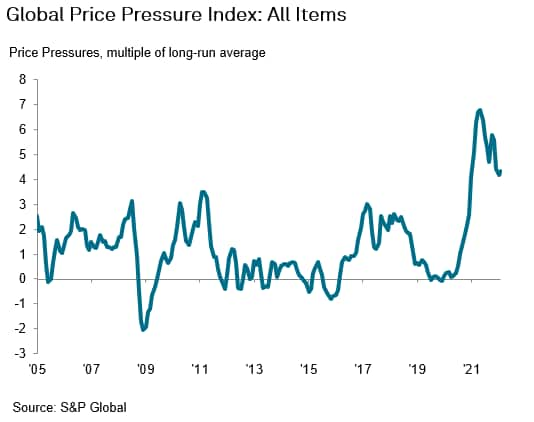
Inflationary pressures were sustained in February, with the number of manufacturing firms worldwide reporting higher prices for raw materials nearly four-and-a-half times higher than normal. A fresh series record of higher prices was reported for semiconductors, while reports of rising energy prices were also at a record high amid surging gas prices. This is in line with S&P Global Pricing and Purchasing data pointing to a renewed record increase in the cost of energy (see below).
In the wake of the Russian invasion of Ukraine the cost of energy became especially volatile, with the benchmark for global oil prices (Brent) exceeding $130 per barrel at the start of the conflict. Moreover, given the dependence of European economies on Russian gas and existing price and supply pressures, reports of rising energy costs and strained supply are likely to continue throughout the year.
Strong commodity price inflation and ongoing supply shortages reported in February
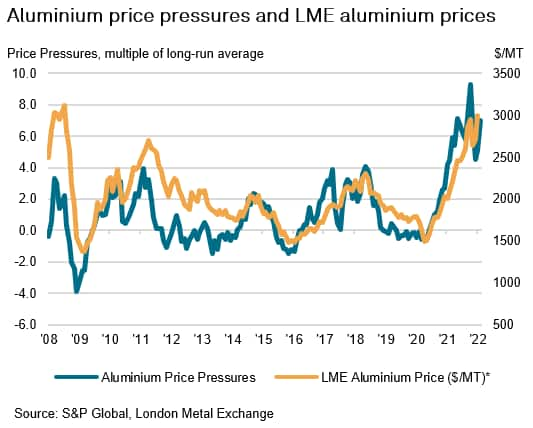
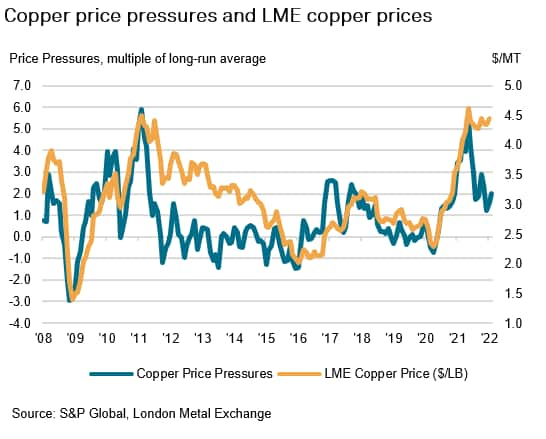
Comparisons of benchmark pricing data against Price Pressure Indicators derived from Manufacturing PMI surveys indicates that the latter are a useful bellwether for price trends in commodity markets.
Looking at the price of aluminium and copper on the London Metal Exchange, the respective price pressure indices for the materials are closely correlated with average prices seen over the month.
Pandemic-induced supply shortages ease but remain a driver of global inflation
As has been the case since the middle of 2021, manufacturers globally reported severe disruption in electrical components amid stronger demand. Semiconductor and electrical item shortages have plagued the global manufacturing sector recovery, with an unprecedented number of firms reporting the inputs in short supply. While there were tentative signs of easing pressures at the turn of the year, the rise in COVID-19 cases related to the Omicron variant has forced a renewed rise in the number of companies reporting shortages.
As a result, firms have reported surging price pressures for these inputs with many companies commenting that shortages have led to sharp rises in costs. Moreover, price and supply pressures for semiconductors especially has had a knock-on effect across the global manufacturing sector and has held back a stronger recovery in production, with anecdotal evidence for the JPMorgan Global Manufacturing PMI highlighting material shortages and rising costs as a hinderance to an accelerated recovery. This is most prevalent in key sectors such as automotives, as car production has become increasingly reliant on semiconductor technology.
Price and supply chain outlook
The outlook for global inflationary pressures appears skewed to the upside due to escalating energy prices and renewed disruptions to international supply chains. While COVID-19 restrictions have been lifted across much of the world, supply chain disruption is expected to continue feeding into purchasing prices, especially given heightened concerns surrounding supply chains given the Russia-Ukraine conflict and the prospect of renewed production stoppages in China due to zero-COVID policies.
The pace at which price and supply pressures return to stability will be contingent on how quickly logistical disruptions are resolved and capacity is rebuilt, or in some instances "re-shored" to help resolve supply and demand imbalances.
Hence, the evolution of our PMI Commodity Price & Supply Indicators will be a key component in tracking the health of global supply chains in the wake of new potential disruptions.
The next S&P Global PMI Commodity Price & Supply Indicators release will be available on Friday 1st April 2022.
About S&P Global PMI Price Pressure Indicators
When questioned about purchase prices, survey respondents to S&P Global Manufacturing PMI surveys are also asked to list any specific items that have increased or decreased in price each month. These lists are transformed into Price Pressure Indicators (PPIs), which show the development of price pressures relative to long-run trends. PPIs are calculated from the number of purchasing managers reporting a specific item to have risen in price during a survey month, less the number reporting that item to have fallen in price. Indices are then presented as a multiple of the long-run average since January 2005.
The headline index is the "All Items Index", with individual indices published for the following 25 items and groupings: Semiconductors, Electrical Items, Oil, Transport, Chemicals, Polymers, Polyethylene, Polypropylene, PVC, Rubber, Timber, Paper, Packaging, Food, Textiles, Aluminium, Copper, Iron, Steel, Stainless Steel, Electricity, Energy, Gas, Cartons and Polystyrene.
The index is based such that a value of 1.0 indicates that price pressure is in line with the long-run average. Any figure above 1.0 indicates that price pressures are above the long-run trend, and the higher the figure the faster the rate of increase relative to the average. For example, February data for all items had an index value of 4.3, signalling reports of price increases in February were almost four and a half times the normal amount.
A value above 0.0 but below 1.0 indicates that price pressure is below the long-run trend, and the lower the figure the slower the rate of increase relative to the average. A value of 0.0 means that prices are stable in the reference month.
As purchasing managers have the opportunity to report items which are also falling in price, any figure below 0.0 indicates that reports of price declines exceed those of rising prices, and the lower the figure, the greater the degree of negative price pressure. For example, an index value of -3.0 would signal reports of price declines are three times the normal amount.
About S&P Global PMI Supply Shortage Indicators
Supply shortage indicators (SSI) are calculated using a similar methodology to the PPIs. When questioned about suppliers' delivery times, survey respondents to S&P Global Manufacturing PMI surveys are also asked to list any specific items that have been in short supply each month. These are then transformed to SSIs, for the purpose of showing the development of supply pressures relative to long-run trends.
Therefore, an index value above 1.0 indicates that supply shortages are above the long-run average, and the higher the figure the greater the degree of shortages relative to the trend. For example, latest data showed that the All Items Index had a value of 5.8 which signalled that reports of supply shortages during February were close to six times the normal amount.
A figure below 1.0 would thus indicate that supply shortages are below the long-run trend, and the lower the figure the fewer the number of shortages relative to the average. The SSIs cannot fall below zero.
The headline index is the "All Items Index". In addition, individual indices are published for the following 20 items and groupings: Semiconductors, Electrical Items, Oil, Transport, Chemicals, Polymers, Polyethylene, Polypropylene, PVC, Rubber, Timber, Paper, Packaging, Food, Textiles, Aluminium, Copper, Iron, Steel and Stainless Steel.
Usamah Bhatti, Economist, S&P Global Market Intelligence
Tel: +44 1344 328 370
usamah.bhatti@spglobal.com
© 2022, IHS Markit Inc. All rights reserved. Reproduction in whole
or in part without permission is prohibited.
Purchasing Managers' Index™ (PMI™) data are compiled by IHS Markit for more than 40 economies worldwide. The monthly data are derived from surveys of senior executives at private sector companies, and are available only via subscription. The PMI dataset features a headline number, which indicates the overall health of an economy, and sub-indices, which provide insights into other key economic drivers such as GDP, inflation, exports, capacity utilization, employment and inventories. The PMI data are used by financial and corporate professionals to better understand where economies and markets are headed, and to uncover opportunities.
This article was published by S&P Global Market Intelligence and not by S&P Global Ratings, which is a separately managed division of S&P Global.
{"items" : [
{"name":"share","enabled":true,"desc":"<strong>Share</strong>","mobdesc":"Share","options":[ {"name":"facebook","url":"https://www.facebook.com/sharer.php?u=http%3a%2f%2fprod.azure.ihsmarkit.com%2fmarketintelligence%2fen%2fmi%2fresearch-analysis%2fglobal-manufacturers-signal-record-increase-in-prices-paid-for-energy-and-semiconductors-in-february-Mar22.html","enabled":true},{"name":"twitter","url":"https://twitter.com/intent/tweet?url=http%3a%2f%2fprod.azure.ihsmarkit.com%2fmarketintelligence%2fen%2fmi%2fresearch-analysis%2fglobal-manufacturers-signal-record-increase-in-prices-paid-for-energy-and-semiconductors-in-february-Mar22.html&text=Global+manufacturers+signal+record+increase+in+prices+paid+for+energy+and+semiconductors+in+February+%7c+S%26P+Global+","enabled":true},{"name":"linkedin","url":"https://www.linkedin.com/sharing/share-offsite/?url=http%3a%2f%2fprod.azure.ihsmarkit.com%2fmarketintelligence%2fen%2fmi%2fresearch-analysis%2fglobal-manufacturers-signal-record-increase-in-prices-paid-for-energy-and-semiconductors-in-february-Mar22.html","enabled":true},{"name":"email","url":"?subject=Global manufacturers signal record increase in prices paid for energy and semiconductors in February | S&P Global &body=http%3a%2f%2fprod.azure.ihsmarkit.com%2fmarketintelligence%2fen%2fmi%2fresearch-analysis%2fglobal-manufacturers-signal-record-increase-in-prices-paid-for-energy-and-semiconductors-in-february-Mar22.html","enabled":true},{"name":"whatsapp","url":"https://api.whatsapp.com/send?text=Global+manufacturers+signal+record+increase+in+prices+paid+for+energy+and+semiconductors+in+February+%7c+S%26P+Global+ http%3a%2f%2fprod.azure.ihsmarkit.com%2fmarketintelligence%2fen%2fmi%2fresearch-analysis%2fglobal-manufacturers-signal-record-increase-in-prices-paid-for-energy-and-semiconductors-in-february-Mar22.html","enabled":true}]}, {"name":"rtt","enabled":true,"mobdesc":"Top"}
]}


