Customer Logins
Obtain the data you need to make the most informed decisions by accessing our extensive portfolio of information, analytics, and expertise. Sign in to the product or service center of your choice.
Customer Logins
BLOG
Oct 30, 2020
Daily Global Market Summary - October 30, 2020
US and APAC equity markets closed lower, while European markets closed mixed after a very challenging week for global equity and credit markets. US and most European benchmark government were lower on the day and most credit indices closed slightly wider across both regions. Oil was lower again on the potential for a slowdown in demand driven by the second wave of COVID-19 restrictions, with prices for both Brent/WTI near the lowest levels since late-May. The US dollar closed slightly lower, while gold and silver were higher on the day. The markets will be closely watching for further COVID-19 restrictions next week, alongside Tuesday's US elections, Q3 earnings reports, and Friday's US employment report.
Americas
- US equity markets closed lower on the day and week-over-week; Nasdaq -2.5%/-5.5% week-over-week, Russell 2000 -1.5%/-6.2% week, S&P 500 -1.2%/-5.6% week, and DJIA -0.6%/-5.5% week.
- 10yr US govt bonds closed +5bps/0.88% yield and 30yr bonds +5bps/1.66% yield, with both ending the week 13bps higher than the week's lowest intraday yield on Wednesday.
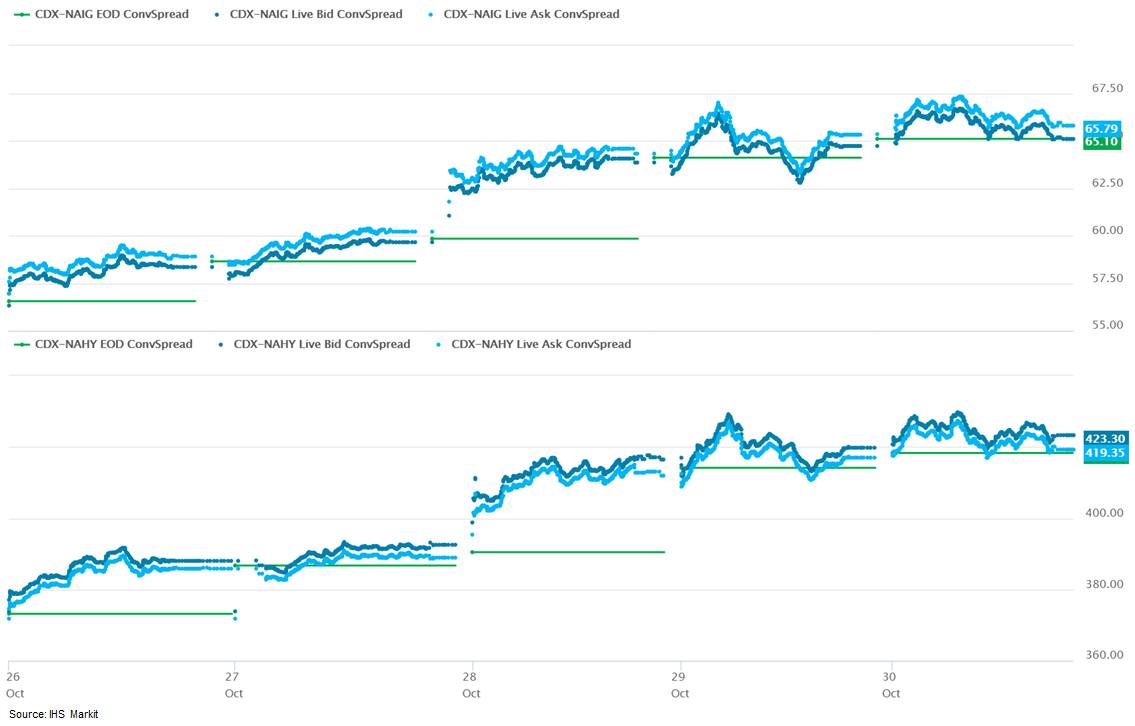
- CDX-NAIG closed flat/65bps and CDX-NAHY +3bps/421 bps, which is
+8bps and +48bps week-over-week, respectively.
- DXY US dollar index closed -0.1%/93.90.
- Gold closed +0.6%/$1,880 per ounce and silver +1.2%/$23.65 per ounce.
- Crude oil closed -1.1%/$35.79 per barrel, which is its lowest close since 1 June.
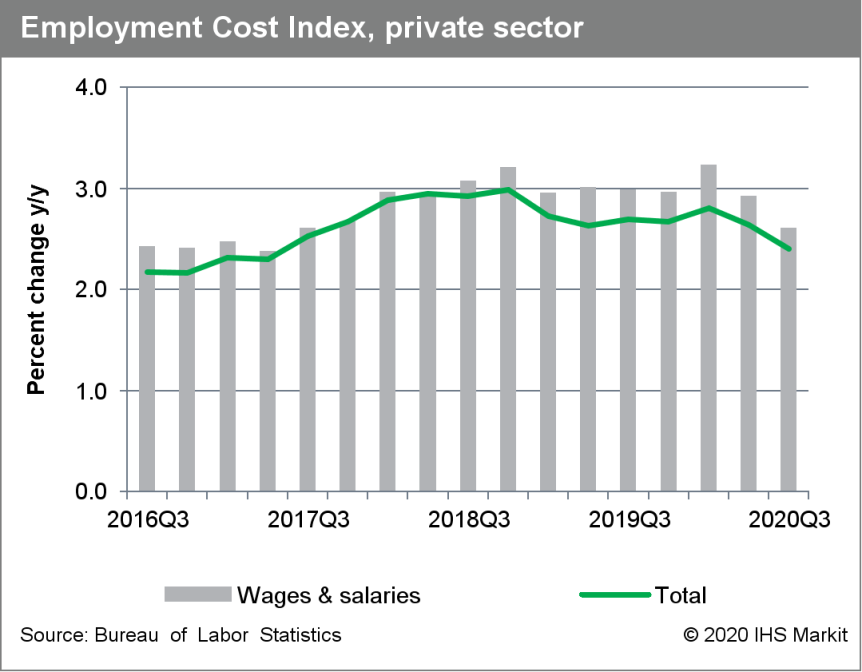
- The Employment Cost Index (ECI) increased 0.5% for the
three-month period ended in September 2020 (the reference day is
the pay period that includes the 12th day of September). (IHS
Markit Economist Patrick Newport)
- Year-over-year (y/y) growth was 2.4%, a dip from the June 2020 reading of 2.7%.
- Year-over-year real growth was 1.2%, just higher than the 1.0% y/y reading of September 2019 (the Bureau of Labor Statistics calculates real growth using the consumer price index as the price deflator).
- Wages and salaries (about 70% of compensation costs) rose 0.4% for the three-month period ended September 2020 and 2.7% y/y; benefits (about 30% of compensation) increased 0.6% for the three-month period ending September 2020 and 2.3% y/y.
- Private industry compensation grew 2.4% y/y, wages and salaries (about 70% of compensation costs) rose 2.7%, and benefits (about 30% of compensation) grew 2.0%.
- State and local government compensation increased 2.3% y/y; for this sector, wages and salaries (about 62% of compensation costs) rose 1.8% and benefits (about 38% of compensation) grew 3.2%.
- The index measuring how much private industry health benefits cost employers rose 1.8% y/y, down from 2.0% y/y in September 2019.
- Response rates were "comparable with prior releases," according to the report.
- This is the second pandemic reading. The private industry index has slowed to 2.4% from a pre-pandemic 2.5-2.7%. During the Great Recession, this index slowed from 3.0% in the second quarter of 2008 to 1.2% five quarters later. The milder slowdown this time can be considered a good thing if it is validated by stronger productivity growth. But if it results from sticky wages, as it likely has, employers will slow hiring, slowing the decline in the unemployment rate.
- The Federal Reserve watches this index closely because it
measures total compensation, not just gains in wages and salaries.
Some forms of compensation, such as tips, payment in kind, and
stock options, are not incorporated into the index. The survey also
excludes some civilian workers, including self-employed business
owners, employees at private households, and federal
employees.
- Personal income increased 0.9% in September and real disposable
personal income (DPI) advanced 0.7%. Employee compensation (+0.8%)
and proprietors' income (+5.1%) were the primary positive
contributors to personal income. (IHS Markit Economists James
Bohnaker and David Deull)
- Transfer receipts were a small negative for personal income in September, declining 0.1% month on month. Fewer disbursements from the Pandemic Unemployment Compensation (PUC) program—weekly supplemental payments of $600 that expired on 31 July—and other pandemic unemployment insurance programs were largely offset by other transfer receipts. Namely, "lost wages supplemental payments"—money redirected from FEMA to individuals impacted by the pandemic—increased $275.6 billion (annual rate).
- Monthly growth of real PCE kicked up to 1.2% in September after slowing in August; this gain was stronger than expected and resulted in a 0.7 percentage point upward revision to our fourth-quarter forecast for real PCE, which now stands at 5.2%.
- Consumers continued to spend strongly on durable goods, where growth of 2.9% in September jolted real PCE on durable goods to a level that was 13.9% above its pre-pandemic February mark. Services continued to lag, with growth of 0.8% in September; this nudged real PCE on services to a level that was 7.3% below February.
- Although incoming data for personal income and outlays have exceeded expectations, we remain guarded about consumer spending over the next several quarters given the "third wave" of COVID-19 cases, waning fiscal support, and exhaustion of demand for durable goods.
- The US University of Michigan Consumer Sentiment Index rose 1.4
points (1.7%) to 81.8 in the final October reading, the highest
since March. The index has recovered one-third of its decline from
February to April and its sluggish rise is consistent with our
expectation for sharply slower growth of consumer spending in the
fourth quarter. (IHS Markit Economists David Deull and James
Bohnaker)
- The final October Consumer Sentiment reading was 0.6 point higher than the preliminary reading, suggesting that sentiment was stable over the course of the month in spite of rising rates of new COVID-19 infections nationally that have surpassed previous highs.
- The expectations index rose 3.6 points to 79.2, while the current conditions index fell 1.9 points to 85.9.
- Consumer sentiment rose 3.0 points to 80.2 among households earning less than $75,000 a year and edged up 0.3 point to 83.9 among households with earnings above that threshold.
- The expected one-year inflation rate ended the month unchanged from September at 2.6%, while the expected five-year inflation rate fell 0.3 percentage point to 2.4%.
- Perceptions of buying conditions were mixed in October. The index of buying conditions for large household durable goods fell 5 points to 109, while that for vehicles fell 8 points to 119, a six-month low. The index of buying conditions for homes jumped 9 points to 141, the highest since February.
- Indices of buying conditions in the University of Michigan report indicate the net percent of respondents saying it is a "good time to buy" particular items. The decline of these indices for durable goods and vehicles in October is similar to declines seen in the Conference Board's measure of purchasing plans for the same items, and points to a declining rate of growth for consumer spending on durable goods in the coming months, consistent with our forecast. Strength in durable goods spending has propped up consumer spending thus far during the COVID-19 pandemic.
- Tesla is looking to increase its number of service centers sharply in 2021, targeting building one per week, according to media reports. An Eletrek report cites a source familiar with the matter as saying that Tesla has notified its staff of its plan for a significant increase in service centers. Reportedly, Tesla will select locations for the centers where it sees strong demand for its electric vehicles and where its service-center capability is lacking. It is not clear if the target for new service centers is for the United States or globally. Tesla operates 466 service centers globally, but because of its increased sales, it has a need for more service centers. Tesla operates its own sales and service centers directly, whereas traditional automakers use dealership networks. Although Tesla initially expected its mobile service and over-the-air capabilities to be sufficient, as the company increases sales and its vehicles age, the need for servicing increases. Automotive News and Electrek reported on plans for the investment in service centers, but Tesla did not provide a comment or confirmation. (IHS Markit AutoIntelligence's Stephanie Brinley)
- The state of Rhode Island in the United States is calling for the submission of competitive request for proposals (RFP) to procure up to 600 MW of new offshore wind energy. The RFP will be developed by National Grid, with oversight by the state's Office of Energy Resources. Approval will be determined by the Public Utilities Commission. The state is host to North America's first operational offshore wind farm Block Island, and in 2019, received state approval for the 400 MW Revolution Wind offshore wind project. (IHS Markit Upstream Costs and Technology's Melvin Leong)
- Ford has announced that it will reveal an electric version of the full-size Transit van, to be called E-Transit, on 12 November. The van is to be revealed via a virtual event hosted by new CEO Jim Farley. In announcing the reveal, Ford cites a survey noting that consumers in the United States, the United Kingdom, and Germany are increasingly open to deliveries being made using electric and zero-emission vehicles. Ford said, "The world - and the way we power our vehicles - is changing. It's why the time is right for a new type of Transit, something that remains the backbone of commercial business while serving both our community and the environment. Never has there been a better time to realize that doing the right thing is good for business - ours and yours." (IHS Markit AutoIntelligence's Stephanie Brinley)
- Visteon has reported its financial results for the third quarter, including a 2.8% year-on-year (y/y) increase in net sales to USD747 million and net income of USD6 million. In the year to date (YTD), the auto industry supplier's sales are down 20% y/y and the company has reported a net loss of USD74 million. In the second quarter, the coronavirus disease 2019 (COVID-19) pandemic caused plant shutdowns in Europe and the Americas, and in the third quarter, production resumed and, in many areas, was focused on replenishing inventories, even in the face of lower demand. As a result, Visteon's production third quarter 2020 was a little better than in third quarter 2019. Visteon states that its gross margin was USD99 million in the third quarter, up from USD84 million in third quarter 2019. However, the company's net income attributable to Visteon of USD6 million in the third quarter was notably lower than USD14 million a year earlier. In the third quarter, Visteon's adjusted net income was USD38 million. The supplier reported adjusted EBITDA of USD87 million in the third quarter, up from USD62 million a year earlier. Visteon stated it was awarded new business of USD1.5 billion during the third quarter and USD3.2 billion in the year to date. (IHS Markit AutoIntelligence's Stephanie Brinley)
- LyondellBasell Industries posted third-quarter net income of
$114 million compared with $965 million in the year-ago quarter.
The combination of an impairment charge on its Houston, Texas,
refinery and an inventory valuation benefit overall reduced net
income by $313 million. Net sales of $6.8 billion were down 23%
year-on-year (YOY).
- Olefins & polyolefins - Americas segment operating income was $309 million, down 41% YOY. Olefins results decreased about $135 million driven by decreases in margins partially offset by an increase in volumes. Ethylene margin decreased primarily due to lower coproduct prices. Polyolefin results decreased approximately $60 million owing to lower margins as a result of reduced spreads, LyondellBasell said.
- Olefins & polyolefins - Europe, Asia, international operating income was $52 million, down 74% YOY. Olefins results decreased approximately $115 million YOY owing to lower margin driven by declining ethylene prices. Combined polyolefins results decreased about $45 million primarily driven by a lower polypropylene price spread over propylene.
- Intermediates & derivatives segment operating income of $180 million was down 43% YOY. Propylene oxide & derivatives and intermediate chemicals results were relatively unchanged offset sharply lower oxyfuels results driven by weaker margins owing to lower gasoline prices and higher feedstock prices. Compounding & solutions results were relatively unchanged with higher margins offset by lower volumes. Advanced polymers results decreased approximately $15 million owing to lower margins and volumes driven by reduced demand.
- Refining segment posted a net loss of $733 million reflecting a $582 million impairment charge. The segment posted a loss of $6 million in the year-ago quarter. Income was lower on weaker margins and volumes in response to lower demand for fuels.
- Technology segment net income was $101 million, up 38% driven by higher licensing revenue.
- Advanced polymer solutions operating income of $116 million was up 73% YOY on favorable inventory benefits. Compared with the prior period, compounding & solutions results were relatively unchanged with higher margins offset by lower volumes. Advanced polymers results decreased approximately $15 million owing to lower margins and volumes driven by reduced demand.
- ElectraMeccanica aims to open six US retail locations by the end of November 2020, offering its three-wheeled electric commuter vehicle. According to an Automotive News report, the stores will be in San Diego, Santa Clara, Walnut Creek, and Brea, California, and Scottsdale and Glendale, Arizona. The stores will be in prominent shopping centers and "strategically positioned in high-visibility areas alongside notable name-brand anchor stores," the company is quoted as saying. CEO Paul Rivera is quoted as saying the plan is "consistent with our rollout strategy… We are continuing with our planned, methodical ramp up in production to ensure quality and consistency," he said. "While we have encountered certain hurdles through this growth process, our team is hard at work making select supply chain and technical improvements." The company already has four stores in the US. The Solo is priced starting from USD18,500, similar to the starting price of the Smart ForTwo, which offered seats for two but failed to capture US attention. As we noted in earlier reports, the three-wheeled, single-seat Solo is classified as a motorcycle in the US, meaning that it has to meet a different set of safety requirements from other electric vehicles (EVs). In addition, it would not be included in the IHS Markit light-vehicle sales and production forecasts. The Solo has a 100-mile range, can drive at highway speeds, and is charged using a standard 100-volt household socket in about six hours. In the US, sales of the Solo are scheduled to start in 2020 and its retail price is expected to be less than USD20,000. In 2018, ElectraMeccanica set up a car-sharing initiative in Canada. (IHS Markit AutoIntelligence's Stephanie Brinley)
- Autonomous truck startup TuSimple has secured property for a logistics hub in AllianceTexas' Mobility Innovation Zone (MIZ) in north Fort Worth. MIZ was launched last year as a platform to test and develop technologies tied to passenger and freight transportation. Hillwood, a real estate company, will establish the space that will support TuSimple to expand its autonomous trucking operations in Texas. Hillwood and TuSimple will begin construction on the project in November, with an expected completion by March 2021. Greg Abbott, Texas Governor, said, "We're pleased to welcome TuSimple to Texas, adding the company to our nation-leading roster of firms engaged in the implementation of next generation mobility platforms. The AllianceTexas Mobility Innovation Zone provides the perfect infrastructure, landscape and scale for the company to launch their national expansion and 'Texas Triangle' operations." TuSimple focuses on developing Level 4 autonomous solutions for the logistics industry. The company currently has about 40 vehicles in its test fleet and expects that fully autonomous operations can be achieved in 2021. Recently, Traton Group and TuSimple announced a global partnership on autonomous trucks, which will involve Scania testing the technology. (IHS Markit Automotive Mobility's Surabhi Rajpal)
- Canada's real GDP by industry output increased 1.2% month on
month (m/m) in August, as output declined in only three industries.
(IHS Markit Economist Arlene Kish)
- The gain in the goods-producing industries (up 0.5% m/m) was weaker than the solid advance in the services-producing industries (up 1.5% m/m).
- Industrial production output was almost flat at 0.1% m/m, as natural resource output losses almost offset manufacturing's gain.
- Statistics Canada estimates September's real GDP by industry output increasing 0.7% m/m and third-quarter real GDP growth to advance 10% from the previous quarter.
- Real GDP's third-quarter gain is in line with October's forecast, and the fourth quarter's increase will be muted given renewed containment measures.
- August's real GDP by industry output climb was bigger than expected as real manufacturing activity increased in the month despite the decline recorded for real manufacturing sales volumes. These two series are typically in sync. On the flip side, oil and gas extraction was down thanks to hefty losses for non-conventional oil extraction (down 7.5%) and the decline in mining and quarrying output. Combined, industrial production was virtually unchanged.
- The services industries did the heavily lifting in the month as education was the biggest contributor to growth as preparations were being made well in advance of the school year. Professional services was a big contributor, and a full month of accommodation and food services openings was also a significant contributor.
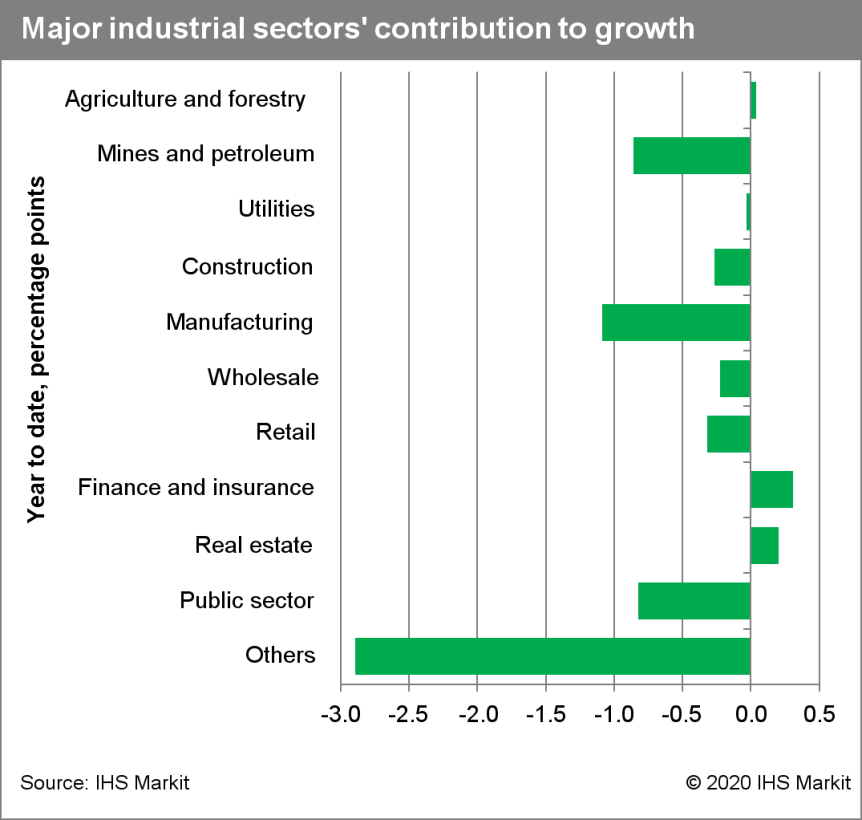
- Among the goods-producing industries, agriculture, forestry,
fishing and hunting, as well as utilities output are above
pre-pandemic February levels. Within services, wholesale trade,
retail trade, finance and insurance, and real estate are the
industries with output surpassing February levels. There are clear
industry winners and losers with the reopening of the economy.
Total economic growth is 4.6% below February levels, with
goods-producing industry output lagging slightly behind
services.
- At its 28 October policy meeting, the Central Bank of Brazil
(Banco Central do Brasil: BCB) left the policy rate at 2.0% and
stated that the current spike in inflation does not alter the
inflation picture in the relevant horizon for monetary policy,
which includes years 2021 and 2022. (IHS Markit Economist Rafael
Amiel)
- Annual inflation has increased in the past four months, reaching 3.1% at the end of September, well above the policy rate.
- Inflation in the food and beverages category has been soaring and reached 13.5% at the end of September; one of the drivers of inflation in the past three months is the correction of petrol prices, driven in turn, by international oil prices. Service inflation remains low.
- The core inflation rate, which excludes volatile items (agriculture and energy prices), was 1.2% in the 12-month period ended in September, which confirms that there has not been contagion from sectors with high inflation to those that enjoy price stability.
- At current levels, the policy rate is at its historic low. The BCB targets inflation at 4.0% +/- 1.5 percentage points.
- Producer prices have increased substantially in the past four months and some of these may continue to pass onto consumer prices. The depreciation of the exchange rate has also been pushing up inflation.
- The BCB's latest statement is very similar to the previous one (16 September); one major difference is that it acknowledges a higher exchange rate and rules out completely the possibility of a hike in the rate in the short term.
- The central bank highlights a number of risks in terms of future action: favoring lower inflation, the output gap - the difference between the potential output and actual output - remains wide, which means that additional demand can be easily met by increases in production without the need to increase prices. This downside risks may intensify if the COVID-19-virus pandemic's negative impact on demand extends further than anticipated and if precautionary savings (because of the COVID-19 virus) increase.
- The Central Bank of the Argentine Republic (Banco Central de la República Argentina: BCRA) published on 28 October its monthly banking-sector bulletin covering August. Among the key figures are the credit growth ratio standing at 33.6% year on year (y/y), below the inflation ratio; the non-performing loan (NPL) ratio standing at 4.9%; and the capital adequacy ratio standing at 23.4% (shareholders' equity stood at 15.1% of total assets). Moreover, profitability remains low for Argentine standards, with the return-on-average-assets (ROA) ratio standing at 2.7%. Regarding the liability side, liquid assets stood at 66.1% of short-term liabilities and the loan-to-deposit ratio stood at 47.1%. One of the latest additions to the bulletin is a series revealing the government's exposure to the public sector: the sum of both sovereign bonds and loans to the government represents 10% of total assets. The limited exposure to the sovereign is a risk-positive factor. This is the first figure revealing the effect of the country's sovereign-debt renegotiation in August. Nevertheless, the government's lack of access to diverse sources of funding is likely to expand this figure as it has increased incentives to rely more on banks to finance its fiscal gap. (IHS Markit Banking Risk's Alejandro Duran-Carrete)
Europe/Middle East/Africa
- European equity markets closed mixed; Spain +0.6%, France +0.5%, Italy +0.4%, UK -0.1%, and Germany -0.4%.
- Most European govt bonds closed lower except for Spain -1bp; UK +4bps, France/Italy +2bps, and Germany +1bp.
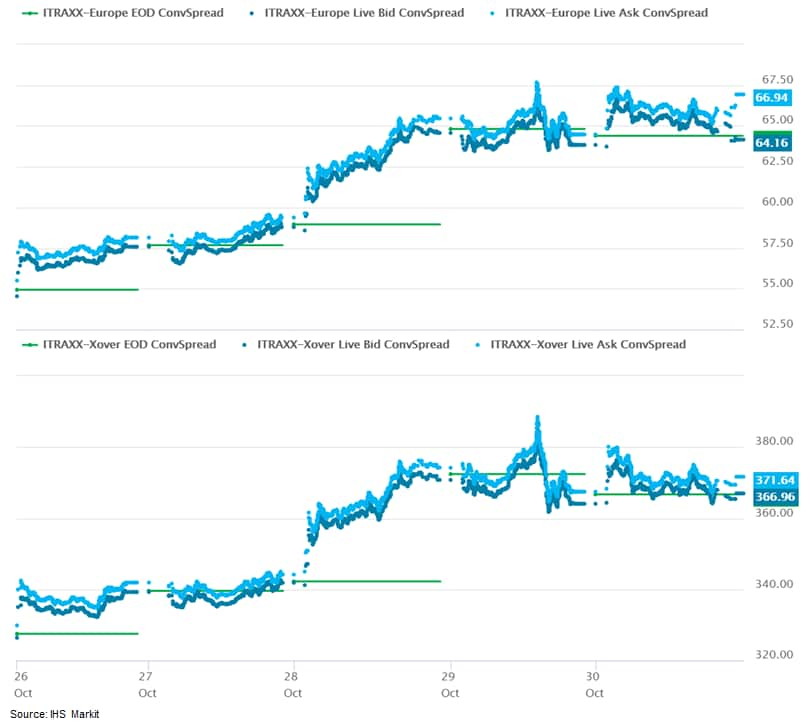
- iTraxx-Europe closed +1bp/66bps and iTraxx-Xover +3bps/369bps,
which is +11bps and +42bps week-over-week, respectively.
- Brent crude closed -0.8%/$37.94, which is its lowest close since 29 May.
- The "preliminary flash" estimate delivered a large upward
surprise, reflecting the prior unwinding of COVID-19 virus
containment measures. But the reverse effect points to a subsequent
contraction in the fourth quarter of the year. (IHS Markit
Economist Ken Wattret)
- The third quarter's double-digit q/q surge in eurozone GDP far surpassed the market consensus expectation (9.4% according to Reuters' survey) and also IHS Markit's baseline forecast (8.3%).
- On a year-on-year (y/y) basis, eurozone GDP fell by 4.3% in the third quarter of 2020, a ten percentage point-plus improvement from the second (-14.8%).
- Despite the third quarter's record rise, GDP remained 4.3% below its pre-pandemic level back in the fourth quarter of 2019 given the exceptionally large declines in the first half of 2020.
- Eurostat's "preliminary flash" estimate is based on the data of 16 of 19 member states, covering 93% of eurozone GDP. Given the exceptional circumstances, subsequent revisions are likely.
- The next "flash" estimate for the third quarter of 2020 will be released on 13 November, along with the first estimate of employment. A breakdown by expenditure component will be released only on 8 December.
- Among the larger member states, upward surprises in the third quarter were most pronounced in France (18.2% q/q), Spain (16.7% q/q), and Italy (16.1% q/q), partly reflecting their relative underperformance in the prior two quarters. German GDP also surprised to the upside (8.2% q/q) but by a smaller margin.
- Factoring in the third quarter's huge upward surprise but leaving IHS Markit's October quarterly forecast profile unchanged from the fourth quarter onwards would imply an annual contraction in eurozone GDP in 2020 of around 6½%, much less severe than our current estimate of around -8%.
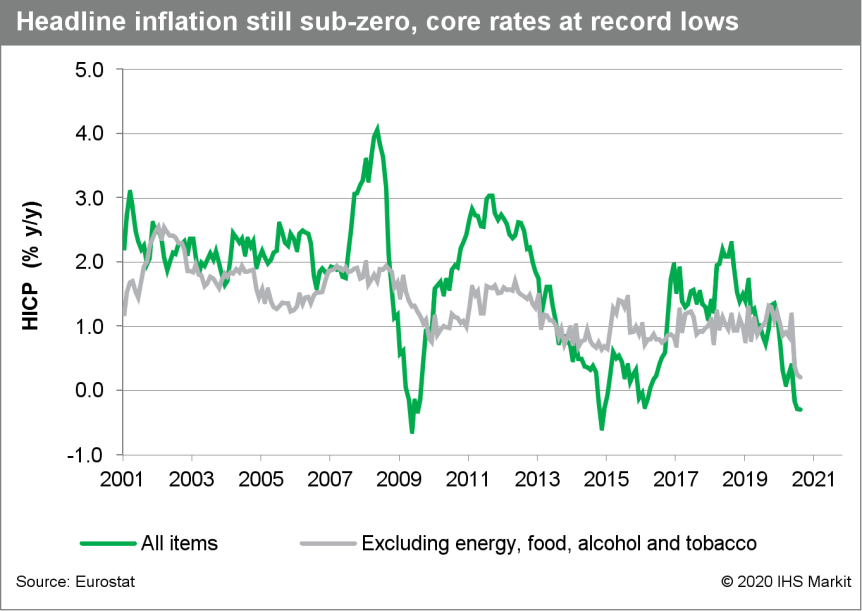
- Having surprised significantly to the downside in August and
September, October's 'flash' HICP data for the eurozone matched
expectations. (IHS Markit Economist Ken Wattret)
- The headline inflation rate remained negative for the third successive month, unchanged at -0.3%. Energy remained the key driver of sub-zero inflation, edging down to -8.4% year on year (y/y).
- The inflation rate excluding food, energy, alcohol, and tobacco prices was unchanged from September at 0.2%, matching its record low.
- The inflation rate for non-energy industrial goods (accounting for around one-third of the core measure above) remained negative for the third straight month but ticked upwards (-0.3% to -0.1%).
- In contrast, services inflation (the other two-thirds) slipped to a new record low (from 0.5% to 0.4%). A full breakdown of October's eurozone HICP by item will be released on 18 November and is likely to show continued weakness in the services items most affected by the COVID-19 virus pandemic, including prices for recreational activities, restaurants, and hotels.
- The impact of the pandemic, measurement challenges, and German VAT reductions all complicate the short-term assessment of inflation developments.
- However, with the output gap having surged, unemployment to
continue to rise, and inflation expectations still uncomfortably
low, the big picture remains one of disinflationary and potentially
deflationary forces in the eurozone.
- "Flash" data released by the Federal Statistics Office (FSO)
shows that German real GDP rebounded by 8.2% quarter on quarter
(q/q) in the third quarter, following declines of 1.9% q/q in the
first quarter and 9.8% q/q in the second. The third-quarter bounce,
although somewhat stronger than we had expected (7.0%), still
leaves GDP 4.2% below that of the final quarter of 2019, prior to
the pandemic. Revisions to the first two quarters were minimal and
mutually offsetting. (IHS Markit Economist Timo Klein)
- The year-on-year (y/y) rate based on the calendar and seasonally adjusted series is now -4.2%, up from the second-quarter record low of -11.2%. For comparison: At its worst in the first quarter of 2009, GDP had slumped to -7.0% y/y during the global financial market crisis.
- As usual, only the flash data relating to total GDP (real and nominal) have been released today - detailed component data will be released on 24 November. Nevertheless, the qualitative guidance provided by the FSO in its press release reveals that exports, private consumption, and - to a somewhat lesser extent - investment in equipment were the driving factors for the third-quarter recovery. Public consumption and construction played less of a role, but then these components had been the chief stabilizers during the sharp downturn in the previous quarter. The FSO do not indicate whether net exports provided a positive or negative contribution to GDP, but we strongly suspect the former due to exports' stronger decline during the second quarter.
- Owing to the exceptional volatility caused by the lockdown and the subsequent loosening of restrictions, it is impossible to say at this point to what extent consumers satisfied their pent-up demand and how well producers were able to satisfy this with increased production despite lingering supply chain issues. Thus, the direction of the stock of inventories is unclear, but one can safely assume that final domestic demand excluding changes in stocks will have rebounded sharply in any case.
- External trade had been impeded throughout the first half of 2020, hurting exports more than imports. The performance of exports relative to imports should have reversed in the third quarter, not least because many Asian countries, most notably China, lifted lockdown restrictions already from April onwards, which allowed their economies to recover strongly. Germany is one of the prime beneficiaries of recovering Chinese demand, helping sectors such as automobiles, machines, and electrical equipment.
- The stronger-than-expected third-quarter rebound will be broadly offset by the setback now expected for the final quarter of 2020 due to the partial lockdown scheduled for November. Although restrictions will mostly hurt the recreation sector (notably via closed restaurants) and not manufacturing or retail, a modest GDP contraction appears likely in late 2020.
- According to Federal Statistical Office (FSO) data, Germany's
real retail sales excluding cars declined by 2.2% month on month
(m/m; seasonally and calendar adjusted) in September, fully
unwinding their August increase by 1.8% m/m (revised down from
3.1%). In effect, September's retail sales have returned to the
levels observed in June, just before the VAT cut. (IHS Markit
Economist Timo Klein)
- Nevertheless, given the huge rebound in May after the end of the lockdown period, also helped by an extra shopping day, September's unadjusted year-on-year (y/y) rates were 6.5% in real terms and 7.7% in nominal terms. Even adjusting for the shopping day effect, annual rates at 3.9% (real) and 5.1% (nominal) exceeded average growth of 3.1% and 3.7%, respectively, in 2019. This holds all the more in relation to long-term trend growth of 0.6% and 1.3%, respectively.
- The recent above-trend retail sales are attributable to three factors: the temporary VAT cut (July-December 2020), catch-up effects due to the enforced inability to make purchases during the March-April lockdown, and substitution effects with respect to income that cannot be used for services that - for public health reasons - are either not available at all or available only with restricted capacity. Furthermore, with a greater share than usual spent indoors, people want to improve their living conditions at home.
- Major categories of the price-adjusted y/y data for September (total 6.5% y/y; see table below) show a little difference between food sales (6.8%) and non-food sales (6.5%), but differences in performance between sub-groups of the non-food category remain stark. As before, 'internet and mail orders' (up by 21.2% y/y) are far ahead of the rest. 'Furniture/household goods/DIY' (up by 11.1%) and sales in 'specialty stores such as for toys, books, bicycles' (up by 7.7%) also did well, whereas the other major groups of goods all posted declines: pharmaceutical/cosmetic goods by 0.4%, textiles/shoes by 7.3%, and sales at general department stores by 9.9%.
- The robustness of recent retail sales data - notwithstanding September's correction - must not be confused with the situation for consumer demand in general, given the above-mentioned catching-up, substitution, and tax effects. Many services in the recreation and entertainment sectors will remain underutilized until an effective vaccine has been made available (thus likely until at least mid-2021), leading consumers to spend their money on retail goods instead.
- The Volkswagen (VW) Group has moved back into the black for the third quarter and for the first three quarters of 2020 after the losses in the first half of the year, according to a company press release. The firm recorded net profit of EUR2.75 billion in the third quarter, down 31% y/y from EUR3.99 billion last year. The third-quarter profit was generated from revenue which fell by 3.4% y/y to EUR59.36 billion, which was a positive recovery given the extremely difficult environment in the first part of the year. Customer deliveries for the quarter were down by 2.61 million units. The third-quarter operating result stood at EUR3.18 billion which was down 29.9% y/y, from EUR4.813 billion last year, and which was an operating return on sales of 5.4%, down from 7.4% in the third quarter of 2019. Earnings before tax stood at EUR3.61 billion, which was a 29.0% y/y decline. Like all the other major global OEMs, VW experienced an extremely tough first half of the year as a result of the impact on demand, production and confidence from the initial phase of the global COVID-19 virus pandemic. This is reflected in the accelerated falls in revenue, sales and net profit in the first nine months of the year. Sales momentum has started to return, led by the strong recovery in China, although sentiment remains weak in Europe and the United States. For the full year, IHS Markit forecasts the Group's combined light-vehicle sales will be 9.0 million units, down from 10.7 million units last year. (IHS Markit AutoIntelligence's Tim Urquhart)
- UK consumers drank some 2.8 billion liters of packaged water (retail and foodservice) in 2019, compared with just under 3.0 billion liters in 2018. This follows steady incremental increases between 2013 and 2018, reports Statista. However, during 2013 and 2019, total consumption increased by over 745 million liters. Growth was highest in 2014 with 9.6 percent YOY growth. Per capita consumption amounted to an average of 44.9 litres per person in 2018. The UK soft drinks market has seen almost continual growth between 2013 and 2019, with the only drop in market value seen in 2015. The soft drinks market value amounted to over GBP16.3 billion (USD21.1 billion). While the value of the market increased, per capita consumption of soft drinks dropped by five liters/head between 2013 and 2017 but rebounded in 2018. Sales of cola, carbonated soft drinks, concentrates, and fruit juices saw their market shares decline between 2015 and 2018 while bottled water and energy drinks increased their market shares. Coca Cola remains the leading UK brand. (IHS Markit Food and Agricultural Commodities' Neil Murray)
- According to the flash estimate, Italy's real GDP rose by
markedly stronger-than-expected 16.1% quarter on quarter (q/q) in
the third quarter, after falls of 13.0% q/q in the second quarter
and 5.5% q/q in the first. (IHS Markit Economist Raj Badiani)
- Nevertheless, Italian GDP in the third quarter was still 4.5% below its level at the end of 2019.
- Italy's National Institute of Statistics (Instituto Nationale di Statistica: ISTAT) has not provided a detailed breakdown of the data, but it has confirmed sharp rises in value added in industry and services during the third quarter. On the expenditure side, ISTAT reports positive contributions from both domestic demand and net exports.
- The reopening of factories from 4 May triggered a robust rise in industrial production, which is driving the recovery. Specifically, industrial production rose 42.1% month on month (m/m) in May, followed by m/m gains of 8.2% in June, 7.0% in July, and 7.7% in August. Encouragingly, industrial output in August was only 1.8% below the level in February, the month prior to the COVID-19 virus outbreak-related lockdown.
- The pace of Italy's economic recovery is likely to slow notably from the latter stages of this year. According to our October forecast, growth is set to slow to 0.6% q/q in the fourth quarter of 2020 and 1.0% q/q in the first three months of 2021. In addition, the balance of the risks is tilting to the downside.
Asia-Pacific
- APAC equity markets closed lower across the region; South Korea -2.6%, Hong Kong -2.0%, China/Japan -1.5%, Australia -0.6%, and India -0.3%.
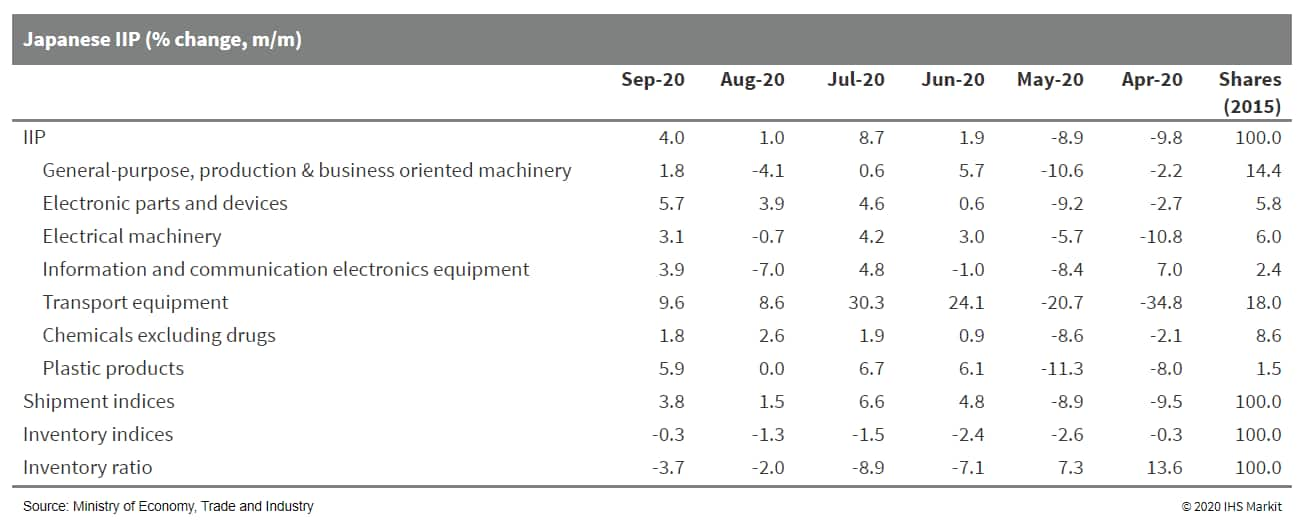
- Japan's index of industrial production (IIP) rose by 4.0% month
on month (m/m) in September and rebounded with a 8.8%
quarter-on-quarter (q/q) rise in the third quarter of 2020
following a 16.9% q/q drop in the previous quarter. Manufacturers'
shipments also continued to rise solidly (up 3.8% m/m) while
inventory fell for the sixth straight month (down 0.3% m/m) and the
index of inventory ratio declined by 2.7% m/m. (IHS Markit
Economist Harumi Taguchi)
- A robust recovery in exports drove the fourth consecutive month of improvement in industrial production. The better-than-expected increase in production was thanks largely to continued solid improvement in production of autos, electric parts and devices, and iron and steel, as well as a rebound in production of machinery.
- Thanks to continued improvement in external demand and the supply chain, destocking in producers goods (including iron and steel and electric parts and devices) progressed and autos and some other industry groupings have begun increasing inventories from historically low levels. That said, the relatively high inventory ratio largely reflected delays in destocking in capital goods and chemical products.
- The September results were better than expected thanks largely
to improved external demand. The progress in destocking means
improved demand could prompt manufacturers to raise production in a
timely manner. However, the continued decline in shipments of
capital goods (excluding transport machinery) in the third quarter
suggests a continued decline in fixed investment could partially
mitigate a rebound of real GDP growth in the third quarter (which
will be released on 16 November).
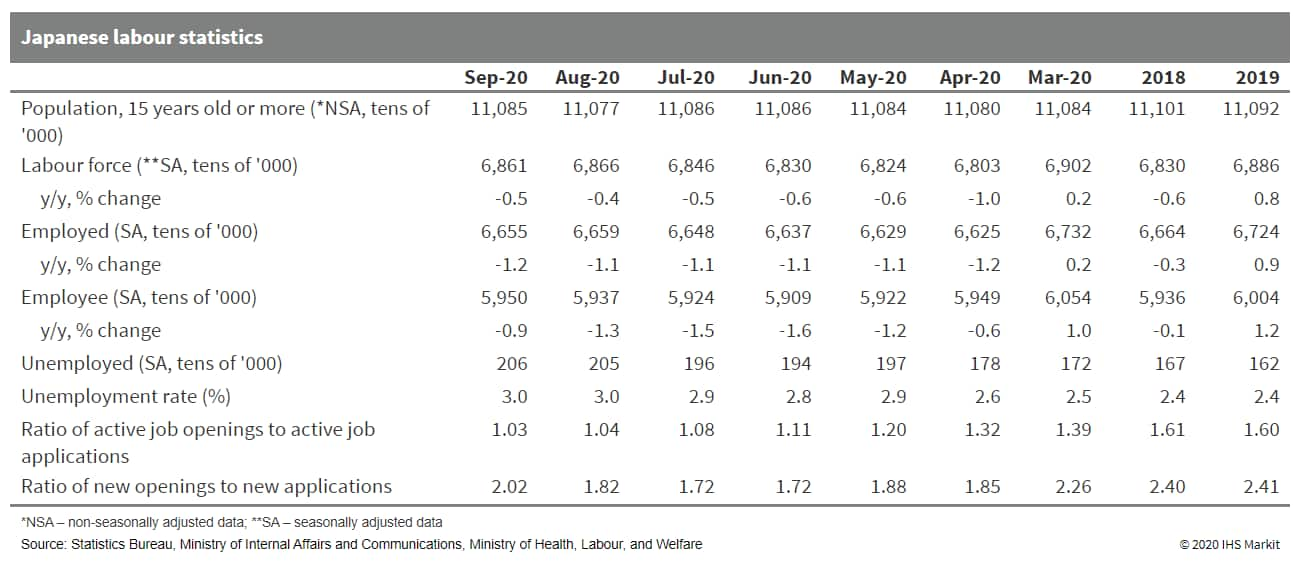
- Japan's unemployment rate held at 3.0% in September, as a
decline in the number of employees was partially offset by a
decline in labor participation. An increase in the number of
unemployed people was largely down to increases in mandatory
retirement or the termination of employment contracts and severe
circumstances of employers or businesses. (IHS Markit Economist
Harumi Taguchi)
- The resumption of economic activities eased the contraction of the number of employees in manufacturing and transport and increased the number of employees in construction and wholesale and retail sales. However, larger y/y declines in accommodation/eating/drinking services (down 10.6%) and increases in the number of furloughs and layoffs reflected a weak recovery of economic activity and downside from social distancing practices.
- Employment conditions remain weak, as the ratio of active job openings to active job applications continued in September, slipping to 1.03, although an increase in ratio of new openings to new applications signaled an improvement in job availability. That said, a faster decline in the ratio for full-timers (0.78) reflected greater applications and weaker job openings for full-time positions.
- The September results suggest employment conditions remain weak
and that it is harder to find new employment. Although new job
openings could increase in line with the resumption of business
activity, the modest pace of a recovery could increase termination
of contracts and turn furloughs into unemployment.
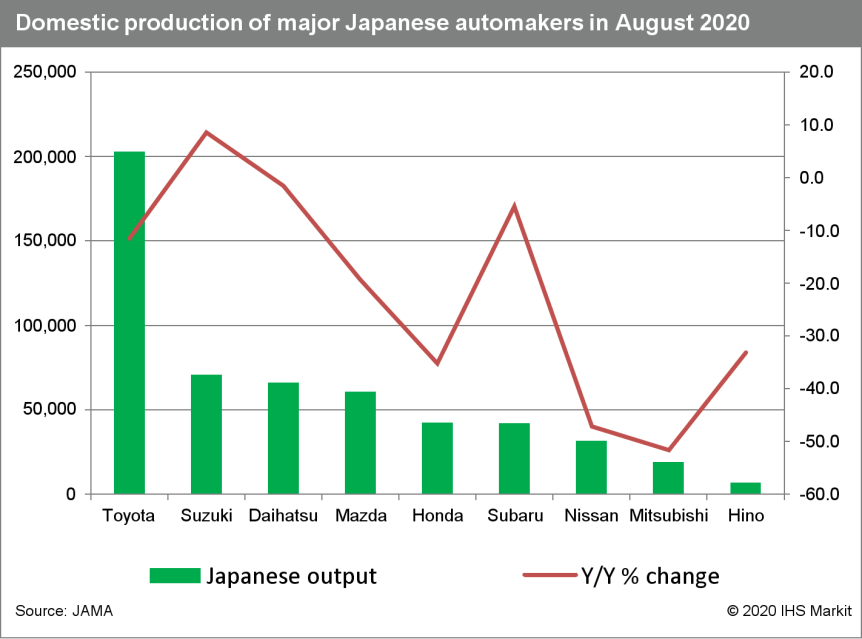
- According to figures released by the Japan Automobile
Manufacturers Association (JAMA) today (30 October), Japanese
vehicle production experienced a decline of 18.0% year on year
(y/y) to 556,276 units during August mainly because the COVID-19
virus outbreak affected automakers' production operations. (IHS
Markit AutoIntelligence's Nitin Budhiraja)
- The figure includes passenger vehicles, trucks, and buses. Output in the passenger car category reached 482,607 units during the month, down by 17.63% y/y.
- Within the passenger car category, production of standard cars with an engine displacement of more than 2.0 liters was down by 21.08% y/y to 294,646 units during the month, while output of small vehicles was down by 10.23% y/y to 92,741 units.
- Production of mini-vehicles, categorized as vehicles equipped with engines smaller than 660cc, was down by 12.85% y/y to 95,220 units. Similar declines were recorded in the truck and bus segments, falling by 17.0% y/y to 69,455 units and by 53.0% y/y to 4,214 units, respectively.
- In January-August, Japanese vehicle production declined by 25.55% y/y to nearly 4.874 million units.
- Output in the passenger car category reached 4.183 million units during the period, down by 25.75% y/y, while truck production declined by 23.0% y/y to 643,187 units and bus output by 37.7% y/y to 48,236 units.
- The significant drop in production in August was also due to a higher base of comparison. There was a rush in demand for new vehicles in August and September last year as the VAT rise was scheduled for implementation in October 2019, which increased the production of vehicles in these months last year.
- The Japanese individual cautiousness, social distancing, and lower household incomes could continue to suppress consumer spending over the short term.
- In the Japanese automotive sector, eco-car tax breaks were re-extended for two more years from April 2019 to March 2021, but with more stringent fuel economy standards.
- Tax breaks for greener cars were also extended for two more years from April 2019 to March 2021.
- Automobile tax is also permanently reduced for engine size displacement of more than 1 liter. These could support demand for new vehicles.
- According to IHS Markit's forecasts, Japanese light-vehicle
output is expected to decline by 18.0% y/y to around 7.556 million
units in 2020.
- China's Ministry of Transport has said it will support pilot projects in the field of smart transport such as connected and autonomous vehicles (CAVs) in the cities of Beijing and Shanghai as well as Hebei province, reports the South China Morning Post. Wu Chungeng, policy research director at the Chinese Ministry of Transport, said, "We support cities and autonomous driving companies to accelerate the development and application of autonomous driving technology under the premise of ensuring safety." According to the report, the Ministry of Transport has partnered with the Ministry of Science and Technology to identify research and development tasks required for CAVs as part of considerations ahead of China's 14th five-year plan. China is pushing to commercialize autonomous smart vehicles, which are a key part of the country's "Made in China 2025" plan. In February, 11 central government departments jointly issued the "Strategy for Innovation and Development of Intelligent Vehicles", providing a more realistic vision for the development of autonomous vehicles (AVs). The strategy aims to develop an ecosystem for AVs and to have conditional AVs (Level 3) in large-scale production by 2025. Under the strategy, the country expects to build a complete set of standards for AVs between 2035 and 2050. The country expects to release the Chinese-specification taxonomy of driving automation for vehicles in January 2021, after the draft is completely approved. (IHS Markit Automotive Mobility's Surabhi Rajpal)
- Autotalks, a vehicle communication chipset maker, has partnered with seven consortiums and five carmakers for a demonstration of its cellular vehicle-to-everything (C-V2X) solution in Shanghai (China). The demonstration took place as part of the China SAE Congress and Exhibition's "New Four Layers" event. During the demonstration, Autotalks' OEM partners conducted rides for hundreds of visitors, exhibiting capabilities at all levels: chipset, system, software, and security. Autotalks said that its V2X solution complies with the latest Chinese C-V2X standards and that the solution is ready for deployment in China as well as in other international markets. Ram Shallom, Autotalks' vice-president of business development and marketing in Asia Pacific (APAC), said, "This year's New Four Layers event is an important milestone for the Chinese V2X industry, since it shows industry readiness for mass rollout of C-V2X. In this event, Autotalks showed that it is a trusted chipset supplier for the Chinese market, with an established, broad and production ready eco-system." (IHS Markit Automotive Mobility's Surabhi Rajpal)
- The South Korean government has unveiled its master plan to boost the adoption of electric vehicles (EVs) and fuel-cell electric vehicles (FCEVs) in the country by expanding the number of charging stations while making such vehicles more affordable, reports the Yonhap News Agency. Under the plan, the government aims to increase the number of EVs and FCEVs on the country's roads to 1.13 million units and 200,000 units, respectively, by 2025. The report highlights that there were 120,000 EVs and 9,500 FCEVs in the country, as of September. To achieve its target, the government aims to have 500,000 EV charging stations by 2025, a sharp rise from around 60,000 units installed throughout the nation as of September. Starting in 2022, new buildings will be obligated to have a certain number of charging stations. The government will install fast-charging stations as well, which will be able to charge up to 80% within 20 minutes. It also plans to increase the number of hydrogen charging stations to 450 by 2025, up from 72 this year; extend tax deductions on the purchase of EVs and FCEVs by 2022; and work closely with private firms to slash the price of major parts, in a bid to reduce the prices of such vehicles. It will roll out a pilot run of the "battery-less" project, in which buyers can purchase EVs without paying for batteries and instead lease them. Furthermore, the government plans to complete drawing up rules for autonomous vehicles (AVs) by 2022, including their safety and insurance regulations, as it seeks to partially adopt Level 4 AVs by 2024. The latest development is in line with the South Korean government's commitment to improve air quality in the country by bringing down particulate levels, fostering hydrogen-related businesses as future growth drivers, and reducing the heavy reliance on imported oil. (IHS Markit AutoIntelligence's Jamal Amir)
- According to the Japan Bank for International Cooperation
(JBIC)'s press release dated 28 October, the development bank,
together with Sumitomo Mitsui Banking Corporation, MUFG Bank,
Mizuho Bank, Shizuoka Bank, and the Bank of Yokohama, will provide
the State Bank of India (SBI) with a total of USD1-billion worth of
loans, financed 60% by the JBIC and the rest by the commercial
banks. The JBIC's press statement noted that the SBI will be
expected to on-lend to "manufacturing and sales business of
suppliers and dealers of Japanese automobile manufacturers as well
as for the provision of auto loans for the purchase of Japanese
automobiles". The JBIC will provide guarantee for the loan lent by
the commercial lenders. (IHS Markit Banking Risk's Angus Lam)
- IHS Markit assesses the guarantee provided by the JBIC to mean a guarantee for the losses incurred by the Japanese commercial banks rather than a guarantee for the loans on-lend by the SBI; therefore, the credit risk arising from lending by the SBI will not be offset as a result.
- As of the June quarter of 2020, the SBI reported that it had INR183.3-billion (USD2.47 billion) worth of loans outstanding to "automobiles and trucks", while outstanding auto loans stood at INR701.5 billion. Based on the higher figure, the loans given by the JBIC (the cost of funding for the SBI was not highlighted) represents close to a significant 10% increase. However, this only means a 0.4% increase in overall lending.
- Indian financial news website LiveMint reported in September that some car dealerships were facing immense difficulties because of the lockdown and the end of the loan moratorium. The additional funding is likely to provide liquidity to at least some of the Japanese players in the sector, reducing immediate cashflow problems.
- The SBI was previously reported to have tighten its lending standards to car dealerships; no update has since been issued. Based on the same tighter lending criteria, the bank is likely to see limited deterioration in its asset quality, with the non-performing loan ratio of automobiles and trucks standing at 5.8% in June.
S&P Global provides industry-leading data, software and technology platforms and managed services to tackle some of the most difficult challenges in financial markets. We help our customers better understand complicated markets, reduce risk, operate more efficiently and comply with financial regulation.
This article was published by S&P Global Market Intelligence and not by S&P Global Ratings, which is a separately managed division of S&P Global.
{"items" : [
{"name":"share","enabled":true,"desc":"<strong>Share</strong>","mobdesc":"Share","options":[ {"name":"facebook","url":"https://www.facebook.com/sharer.php?u=http%3a%2f%2fprod.azure.ihsmarkit.com%2fmarketintelligence%2fen%2fmi%2fresearch-analysis%2fdaily-global-market-summary-october-30-2020.html","enabled":true},{"name":"twitter","url":"https://twitter.com/intent/tweet?url=http%3a%2f%2fprod.azure.ihsmarkit.com%2fmarketintelligence%2fen%2fmi%2fresearch-analysis%2fdaily-global-market-summary-october-30-2020.html&text=Daily+Global+Market+Summary+-+October+30%2c+2020+%7c+S%26P+Global+","enabled":true},{"name":"linkedin","url":"https://www.linkedin.com/sharing/share-offsite/?url=http%3a%2f%2fprod.azure.ihsmarkit.com%2fmarketintelligence%2fen%2fmi%2fresearch-analysis%2fdaily-global-market-summary-october-30-2020.html","enabled":true},{"name":"email","url":"?subject=Daily Global Market Summary - October 30, 2020 | S&P Global &body=http%3a%2f%2fprod.azure.ihsmarkit.com%2fmarketintelligence%2fen%2fmi%2fresearch-analysis%2fdaily-global-market-summary-october-30-2020.html","enabled":true},{"name":"whatsapp","url":"https://api.whatsapp.com/send?text=Daily+Global+Market+Summary+-+October+30%2c+2020+%7c+S%26P+Global+ http%3a%2f%2fprod.azure.ihsmarkit.com%2fmarketintelligence%2fen%2fmi%2fresearch-analysis%2fdaily-global-market-summary-october-30-2020.html","enabled":true}]}, {"name":"rtt","enabled":true,"mobdesc":"Top"}
]}


