Customer Logins
Obtain the data you need to make the most informed decisions by accessing our extensive portfolio of information, analytics, and expertise. Sign in to the product or service center of your choice.
Customer Logins
ECONOMICS COMMENTARY
Oct 27, 2025
Comparing the PMI with GDP for major economies, pre- & post-pandemic

A key advantage and common use of the PMI survey data isto track and anticipate official data relating to economic growthas measured by gross domestic product (GDP). Correlations show that the PMI continues to act as a reliable indicator of GDP growth since the pandemic, in Europe matching or outperforming relative to pre-pandemic experience, though in the US under-performing. However, given differences in GDP and PMI coverage, and with GDP prone to sometimes major revision (and with the quality of GDP coming under growing scrutiny and concern), we contend that the PMI can provide the better and timelier guide to economic trends, especially for users primarily focused on the performance of the corporate sector.
Difficulties in measuring the economy
The yardstick by which the accuracy of business surveys such as the Purchasing Managers' Index (PMI) is commonly measured is the degree to which these privately-produced economic indicators can accurately track and anticipate official gross domestic product (GDP) data. The latter are widely held to be benchmark data on the rate of economic growth. However, it is important to question the value of GDP in several respects, especially in recent times.
First, GDP data are prone to sometimes major revision, meaning initial estimates can sometimes send incorrect signals.
Second, GDP data often diverge from other key metrics on the economy's performance, sending misleading and confusing signals on the health of an economy, possibly reflecting measurement issues.
Third, by attempting to capture all forms of economic activity, GDP data can be of limited use to those primarily interested in the performance and health of the corporate sector of an economy, which is often the most important as this is the section of the economy that will be most closely correlated with financial market asset prices.
All these issues can in fact be avoided by watching PMI survey data. This is why central banks tend to monitor the privately-produced surveys so closely when assessing the performance of the economy. Concerns have only grown in recent years over the quality of official economic data, notably in both the UK and the US, given cuts to government funding for official statistical agencies and deteriorating response rates to official surveys used to collect these economic data.
A July 2025 Reuters poll found that 89 of the 100 top economists were concerned about the quality of official US economic data, including 41 who said they were "very concerned". This partly reflects a deterioration in US official survey participation rates over the past decade. As noted by Douglas Williams of the Office of Survey Methods Research's Federal Economic Statistics Advisory Committee in December 2022"…there are a significant number of reports of completion rates declining, or where achieving a satisfactory completion rate is becoming increasingly more difficult." In other words, agencies such as the Bureau for Economic Analysis and Bureau for Labor Statistics in the US are struggling to get enough households and businesses to participate in surveys to generate economic data. And that was before the federal business cutting and DOGE (Department of Government Efficiency-led) layoffs implemented in 2025 by the Trump Administration.
A similar trend is seen in the UK where, for example, the response rates to the household survey from which consumer spending data (comprising approximately 60% of GDP) are partly derived have steadily fallen from around 70% in the 1980s and 1990s to less than 30% in recent years.
GDP revisions
The impact on GDP is in part visible through the revisions to initial estimates. First estimates are made as quickly as possible by government statisticians based on partial information from companies, government offices and households, with gaps filled by estimation and modelling by expert statisticians. As more data become available, these initial estimates are then revised to more accurately reflect economic growth in each quarter. These revisions are by no means unusual, and are often sizeable, to the extent that some initial estimates of an economy shrinking or growing strongly have been revised to show the exact opposite.
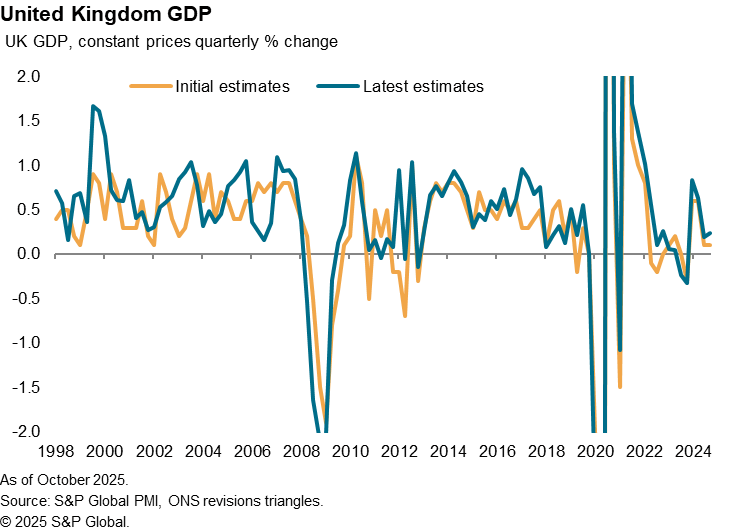
In the United Kingdom, for example, over the two decades prior to the pandemic the initial estimate of quarterly economic growth has been revised by an average of 0.3% if +/- signs are ignored. The maximum was a 1.1% revision. Importantly periods such as 2017, for which initial estimates pointed to only modest growth, are now shown to have been especially strong periods of expansion. A downturn in the spring of 2019 has been revised away, as was the feared triple-dip recession after the global financial crisis. Prior to the global financial crisis, the initial estimates of GDP bear very little in common with the latest GDP estimates for these years.
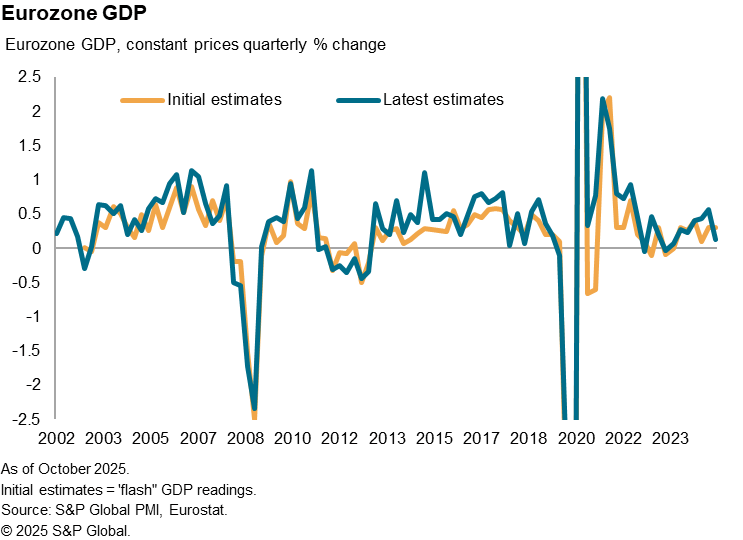
In the eurozone, since 2003 - when initial estimates first became available - the average absolute error (ignoring +/- signs) of GDP initial estimates relative to latest estimates was 0.2% in the years before the pandemic. The maximum was a 0.8% revision. However, there is a clear tendency for initial ("flash") GDP estimates to understate GDP growth over the past two decades as eventually determined by the latest GDP estimates. Initial estimates are in fact twice as likely to be revised higher than lower. This is most evident in the years leading up to the pandemic. Between mid-2013 and mid-2019 initial GDP estimates were revised lower on only five occasions, but revised higher on some 20 occasions.
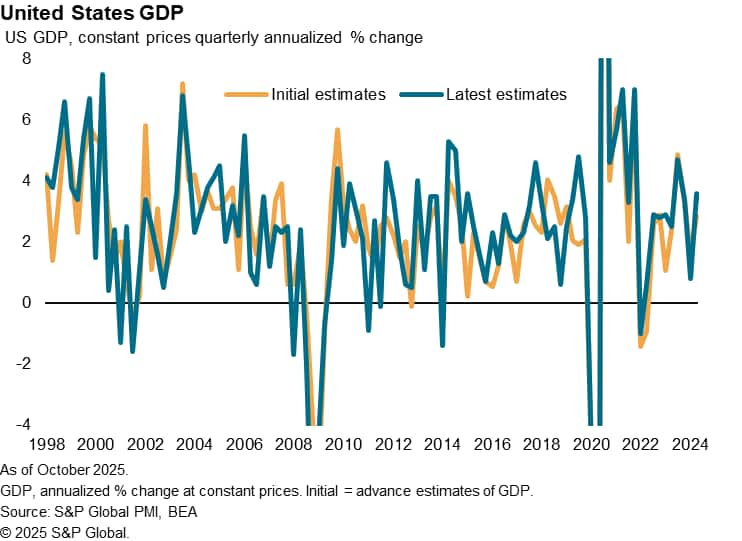
In the United States, where users tend to look at GDP data in annualized growth terms, the average error in the two decades prior to the pandemic is 1.2% if +/- signs are again ignored (which also equates to around 0.3%). The maximum was a +4.9% annualized revision (roughly 1.2% on a quarterly basis). However, it is worth noting that the correlation between initial (advance) estimates of GDP and the latest estimates for each period fell to just 45% in the decade prior to the pandemic against a longer-run pre-pandemic average of 76%. This suggests that the value of initial estimates in providing an advance indication of GDP has deteriorated over time. More recent data, since the pandemic, are of course still subject to potentially large revision, and are hence excluded from these statistics.
What are we measuring?
In all three of these major economies, it is therefore clear that initial GDP estimates often bear little relation to the latest estimates of growth in the years prior to the pandemic (with more recent years excluded due to scope for ongoing revision to these estimates).
The causes of the revisions can vary, with more complete availability of data over time being a common explanation alongside reviews of seasonality. However, there is also a common need to sometimes "balance" data from output measures of the economy with other measures, which capture income and expenditure, or vice versa.
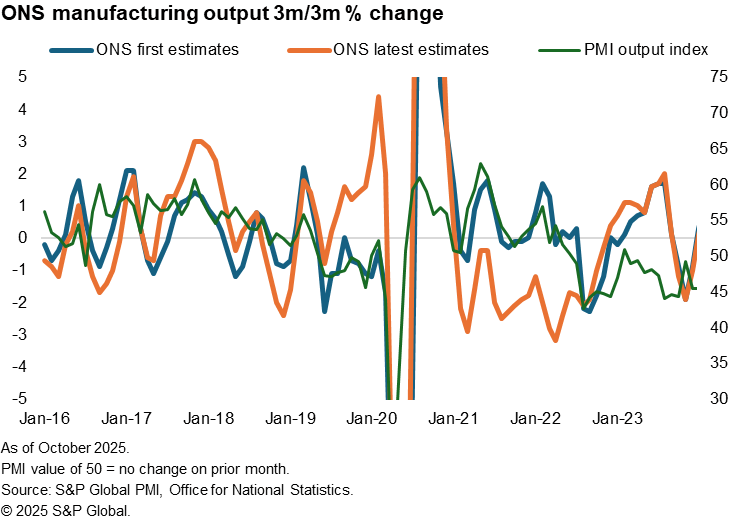
Sometimes, the revisions follow a technical methodological change. A recent example of this was provided by the manufacturing sector element of UK GDP, where the production growth trend prior to the pandemic and in the following two years was revised heavily in 2023.
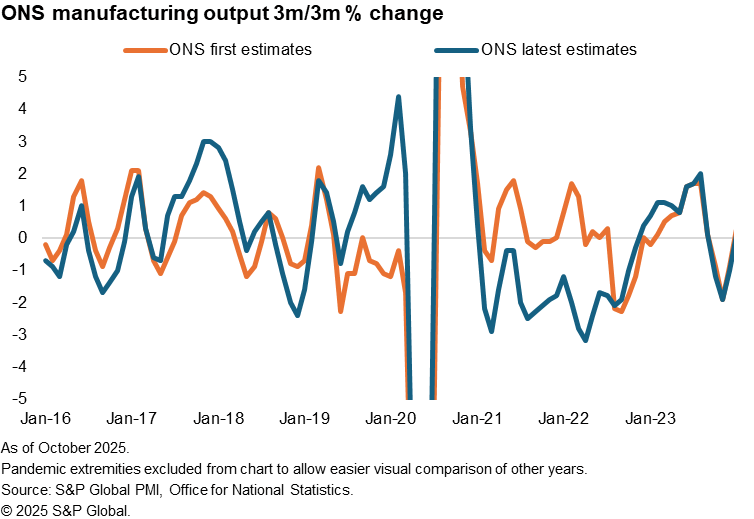
Worryingly, whereas the prior series had correlated well with other related indicators, including official employment data and the business surveys from the PMI and Bank of England, the newly revised series lost all connection with other data sets.
As the compiler of the PMI survey data, we are therefore left uncertain as to whether the PMI data should be measured by its performance against initial estimates of GDP (and its components) or the revised, subsequent estimates for any given economy. Indeed, the analysis raises interesting questions as to whether GDP represents an appropriate benchmark of accuracy at all, particularly given the ongoing concerns over official data surveys. By comparison, unlike the experience of collapsing response rates reported by official surveys, PMI survey response rates have not changed in recent years, with post-pandemic participation rates of 73% on average matching those seen in prior years. However, it's worth exploring the relationships of the PMI data for some of the major economies with these different "vintages" of GDP.
Pre-pandemic relationships of PMI with GDP vintages
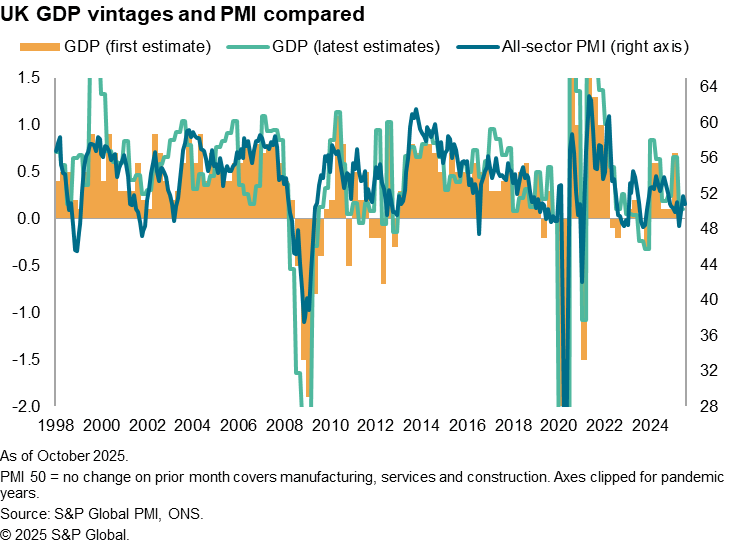
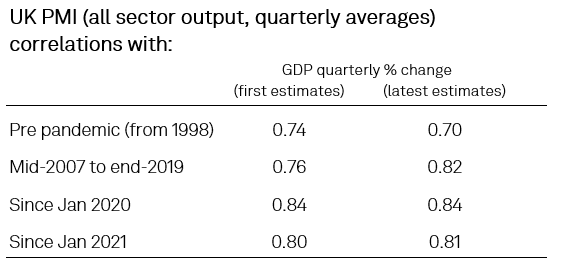
Based on pre-pandemic comparisons (as the more recent GDP data are still prone to revision), the UK PMI output data exhibit a higher correlation with the initial first estimates of GDP (76%) than with the latest (revised) estimates of GDP (70%). These correlations use a quarterly average of the PMI. However, the best fit (77%) is in fact observed with the UK GDP estimates made after three months - the so called "first final estimates" of GDP. Perhaps not coincidentally, these three-month estimates are also considered the purest official measures of output (or GDP(O)), which corresponds most closely with the definition of the PMI's output index.
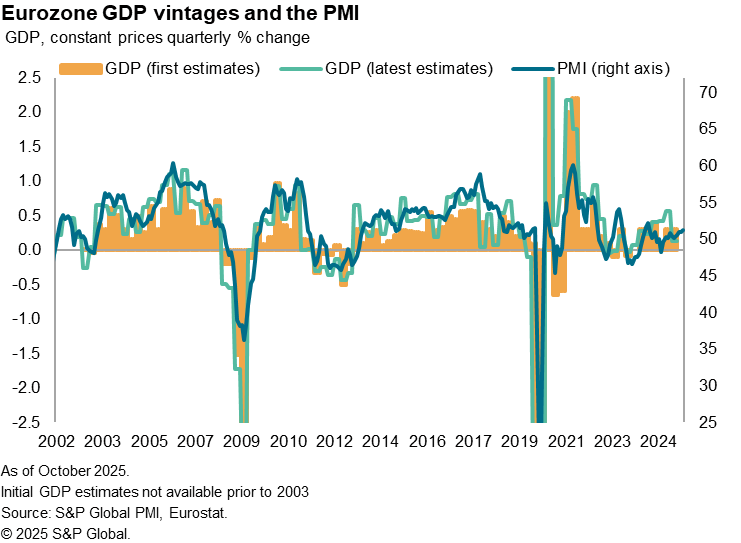
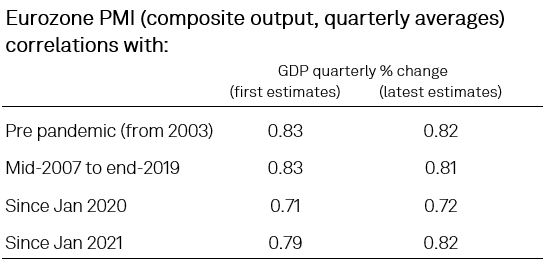
In the eurozone, the quarterly averages of the PMI data also correlate slightly more closely with the first estimates of GDP (83%) than with the latest GDP estimates (82%) in the pre-pandemic years (measured since 2003, when GDP first estimates became available), but it is clear that the PMI has avoided the under-estimation of growth often seen in the first estimates, notably in the decade prior to the pandemic. This corresponds with ECB research which found that "PMI surveys are not only valuable for analysts and policymakers as a timely and reliable GDP tracker, but also for statisticians to potentially improve the accuracy of the first preliminary flash estimate of euro area real GDP."
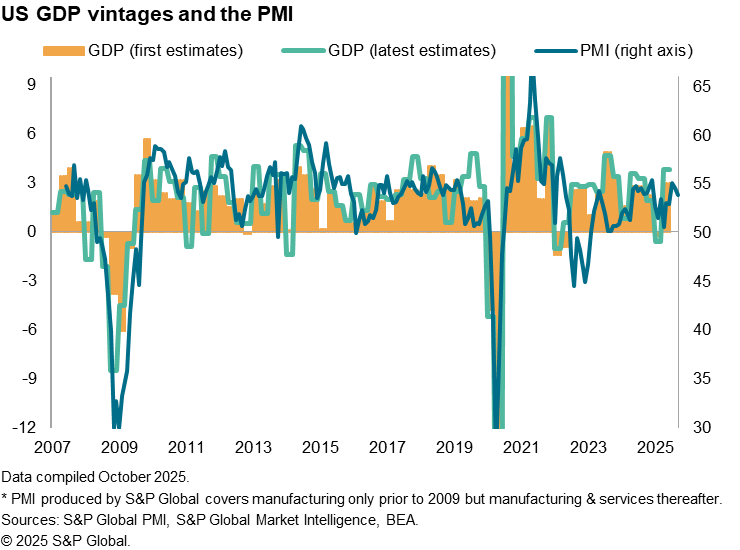
In the US, the PMI data compiled by S&P Global exhibit a slightly higher correlation with initial (advance) GDP estimates (76%) than with the latest (revised) GDP estimates (76%) when the pre-pandemic years are compared.
Post-pandemic relationships of PMI with GDP vintages
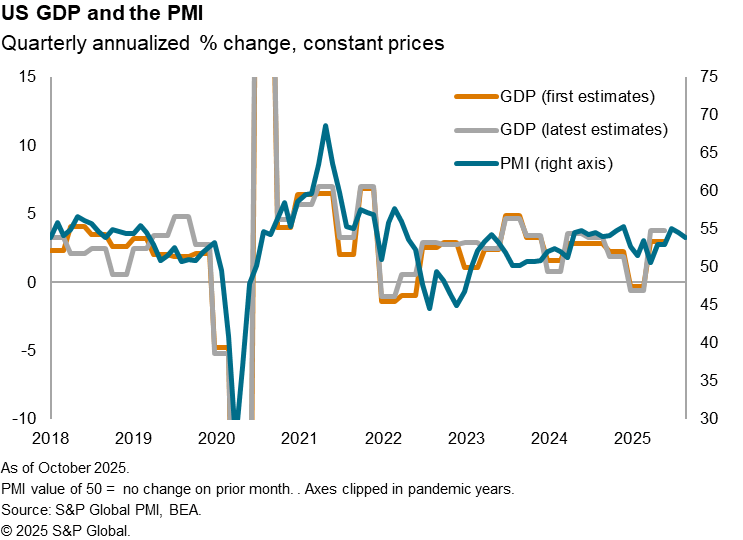
Looking at the performance of the PMI surveys as a predictor of GDP growth rates since the pandemic, the scope for GDP data to be revised further over these more recent years means it is hard at this stage to draw firm conclusions. The pandemic years also create problems, as surveys such as the PMI, which tracks monthly changes in business metrics, are not designed to function at times of complete operational shutdowns in large parts of the economy. Hence the GDP data showed a stronger downturn and commensurately steeper rebound than the PMI data during the most deeply affected COVID-19 affected months. That said, with nearly five years of post-pandemic data now available, we can draw some tentative conclusions from the correlations.
United Kingdom
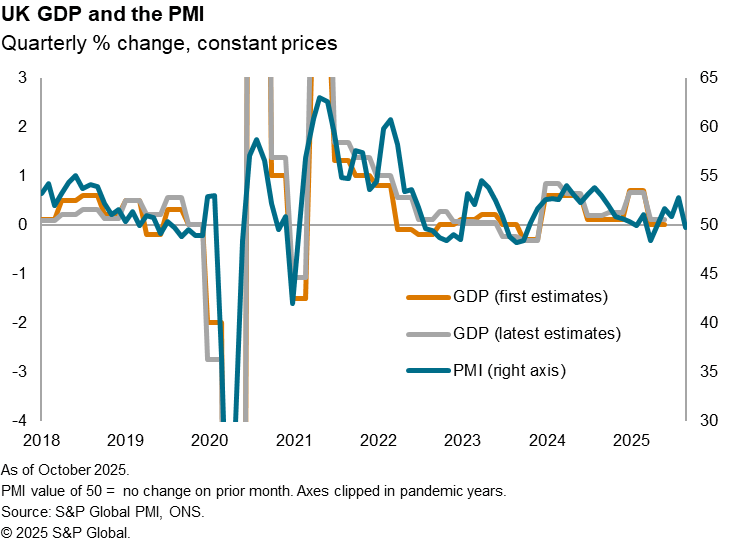
In the UK, at 84%, the correlation of the quarterly average of the PMI all sector output index against both first and latest estimates of GDP since January 2020 exceeds the pre-pandemic correlation, with correlations since January 2021 also exceeding the comparable pre-pandemic statistics but to a lesser degree.
Eurozone
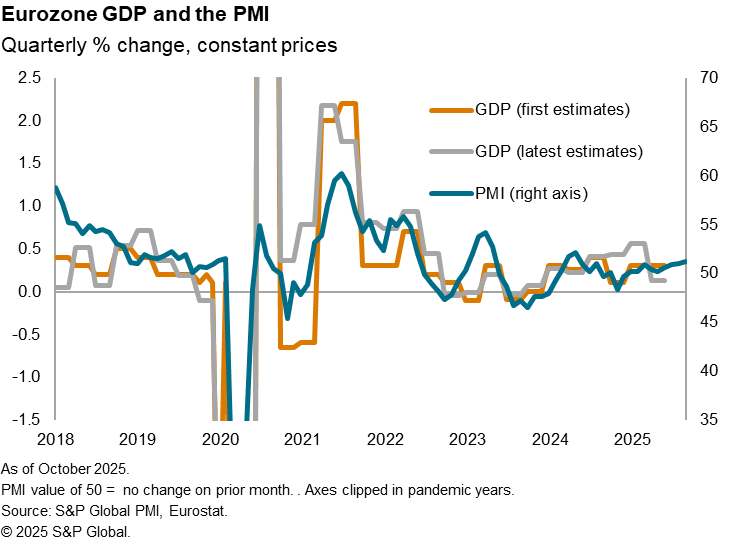
In the Eurozone, at 82%, the correlation of the quarterly average of the PMI all sector output index against the latest estimates of GDP since January 2021 matches the pre-pandemic long-run correlation, albeit with the correlation dropping to 72% if the main pandemic year of 2020 is included.
The sustained high correlation of the PMI with GDP since the pandemic corroborates more detailed research from the ECB, which found that "After losing some predictive capacity during pandemic-related lockdowns and reopenings, the forecast accuracy of the PMI-based short-term forecasting models of the ECB has recovered."
More recently, there has been some divergence from the eurozone PMI with GDP growth in 2025 largely associated with distortions to GDP from inventory building and exports to the US in response to US tariff policy. This has notably led to a rise in GDP that has exceeded that signalled by the PMI index, which focuses purely on output. This disruption has been largely focused on Ireland, where GDP surged 3.2% in the first quarter of 2025 alone.
United States
In the US, the correlation of the PMI with GDP has deteriorated in recent years compared to that seen prior to the pandemic. A correlation of 56% against first estimates of GDP and 53% against latest estimates since 2020 compares with 76% and 74% respectively prior to the pandemic, with the fit worsening further if 2020 is excluded. However, this in part reflects a mis-match in 2022 and 2023, with more recent data coming back into line.
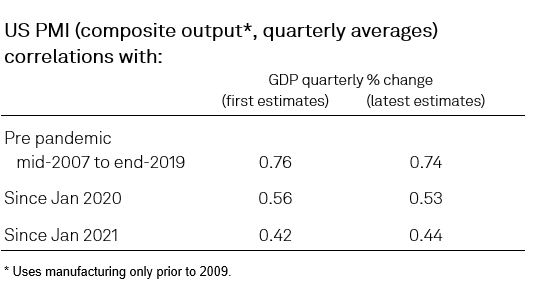
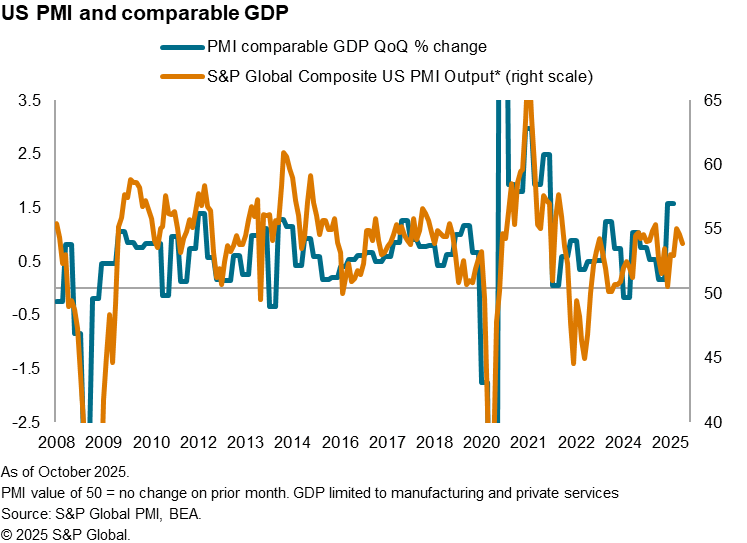
The weaker post-pandemic US correlation in part reflects differences in coverage of the PMI with GDP. If GDP is restricted to the same sectoral coverage of the PMI (namely privately traded services and manufacturing), the post-pandemic (since 2021) correlation rises to 68% against latest estimates of GDP, therefore rising closer to the pre-pandemic average.
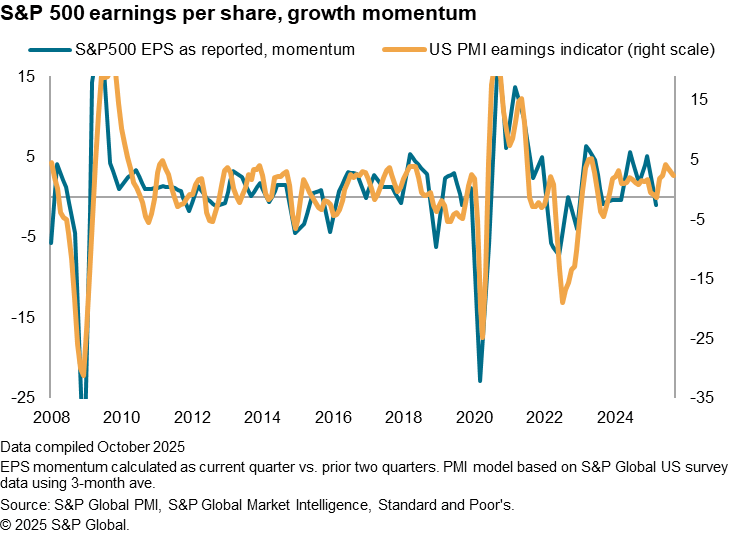
However, while the US PMI data may have diverged from GDP growth somewhat in the years immediately following the pandemic, the survey data have accurately anticipated changing corporate performance in the US over this period, as measured by company earnings per share from the S&P500. A PMI-based indicator of corporate earnings growth in the US exhibits a long-run correlation of 73% against reported earnings, but this rises to 78% since January 2020 and 75% since January 2021.
This suggests that factors other than corporate performance have distorted the US GDP trend from that depicted by the PMI in recent years.
Conclusions
We conclude that the PMI remains a power tool with which to anticipate official GDP data in Europe and the US, even in the case of preliminary GDP estimates which may be subject to revision at a later date. However, growing concerns over GDP data quality in many economies, and past experience of major revisions to data, underscore the caution which must be accorded to GDP numbers, and any discrepancies between GDP growth rates and the PMI should not automatically be attributed to a failure on the part of the surveys. On the contrary, we would encourage scepticism in relation to early GDP estimates in both the eurozone and the US, though also caution against placing too much emphasis on revised GDP data in the UK.
To also answer our own question, the relative accuracy of the PMI in estimating 'final' rather than initial GDP estimates give one an advantage in making earlier and more informed decisions in economic planning such as by policymakers. In cases where GDP forecasts are eventually used to guide investment decisions, PMI data have also demonstrated strong performance when directly applied to guide asset allocation whether on a country or sector level.
Chris Williamson, Chief Business Economist, S&P Global Market Intelligence
Tel: +44 207 260 2329
© 2025, S&P Global. All rights reserved. Reproduction in whole or in part without permission is prohibited.
Purchasing Managers' Index™ (PMI®) data are compiled by S&P Global for more than 40 economies worldwide. The monthly data are derived from surveys of senior executives at private sector companies, and are available only via subscription. The PMI dataset features a headline number, which indicates the overall health of an economy, and sub-indices, which provide insights into other key economic drivers such as GDP, inflation, exports, capacity utilization, employment and inventories. The PMI data are used by financial and corporate professionals to better understand where economies and markets are headed, and to uncover opportunities.
This article was published by S&P Global Market Intelligence and not by S&P Global Ratings, which is a separately managed division of S&P Global.
{"items" : [
{"name":"share","enabled":true,"desc":"<strong>Share</strong>","mobdesc":"Share","options":[ {"name":"facebook","url":"https://www.facebook.com/sharer.php?u=http%3a%2f%2fprod.azure.ihsmarkit.com%2fmarketintelligence%2fen%2fmi%2fresearch-analysis%2fcomparing-the-pmi-with-gdp-for-major-economies-pre-postpandemi.html","enabled":true},{"name":"twitter","url":"https://twitter.com/intent/tweet?url=http%3a%2f%2fprod.azure.ihsmarkit.com%2fmarketintelligence%2fen%2fmi%2fresearch-analysis%2fcomparing-the-pmi-with-gdp-for-major-economies-pre-postpandemi.html&text=Comparing+the+PMI+with+GDP+for+major+economies%2c+pre-+%26+post-pandemic++%7c+S%26P+Global+","enabled":true},{"name":"linkedin","url":"https://www.linkedin.com/sharing/share-offsite/?url=http%3a%2f%2fprod.azure.ihsmarkit.com%2fmarketintelligence%2fen%2fmi%2fresearch-analysis%2fcomparing-the-pmi-with-gdp-for-major-economies-pre-postpandemi.html","enabled":true},{"name":"email","url":"?subject=Comparing the PMI with GDP for major economies, pre- & post-pandemic | S&P Global &body=http%3a%2f%2fprod.azure.ihsmarkit.com%2fmarketintelligence%2fen%2fmi%2fresearch-analysis%2fcomparing-the-pmi-with-gdp-for-major-economies-pre-postpandemi.html","enabled":true},{"name":"whatsapp","url":"https://api.whatsapp.com/send?text=Comparing+the+PMI+with+GDP+for+major+economies%2c+pre-+%26+post-pandemic++%7c+S%26P+Global+ http%3a%2f%2fprod.azure.ihsmarkit.com%2fmarketintelligence%2fen%2fmi%2fresearch-analysis%2fcomparing-the-pmi-with-gdp-for-major-economies-pre-postpandemi.html","enabled":true}]}, {"name":"rtt","enabled":true,"mobdesc":"Top"}
]}