Customer Logins
Obtain the data you need to make the most informed decisions by accessing our extensive portfolio of information, analytics, and expertise. Sign in to the product or service center of your choice.
Customer Logins
EQUITIES COMMENTARY
Sep 25, 2014
Financials' volatility fails to materialise
The last couple of years have seen stocks with large ratios of implied to realised volatility, which have a strong track record of outperformance, fail to deliver strong performance. A look at the phenomenon points to financials which are still viewed with caution by options market despite having low realised volatility over the last couple of years.
- US large cap shares with high volatility spread have outperformed the market by 1.48% a month on average since 1997, this has not been the case of late
- Financials now make up the largest proportion of share in the best ranked decile group
- This surge in volatility spread among financials comes as the sector is on track to underperform the market for the first time in three years
Gauging market risk is primarily done in two ways; observing realised market behaviour, such as past return volatility, or by measuring expected volatility which is mainly observed through options implied volatility. While both these methods generally work in tandem, they can sometimes diverge, resulting in a volatility spread.
Volatility spread strong performer
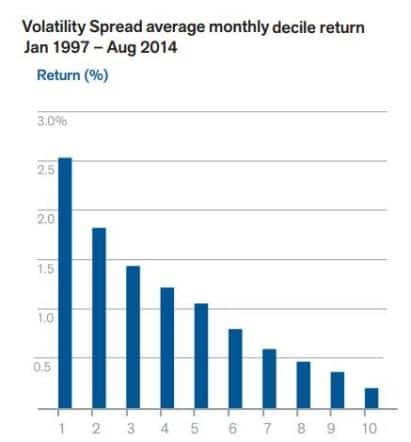
Observing volatility spread over the last 17 years we see that the 10% shares with the largest volatility spread, essentially those which market participants think will have more future implied volatility than that realised in the previous month, have greatly outperformed the market. This outperformance averages a significant 1.48% a month on average over this timeframe which cumulates to 313% over the observation period.

This behaviour, combined with the fact that shares on the opposite end of the volatility spread universe have underperformed the market, makes the volatility spread factor the best performing one amongst the Markit Research Signal suite for US large cap shares.
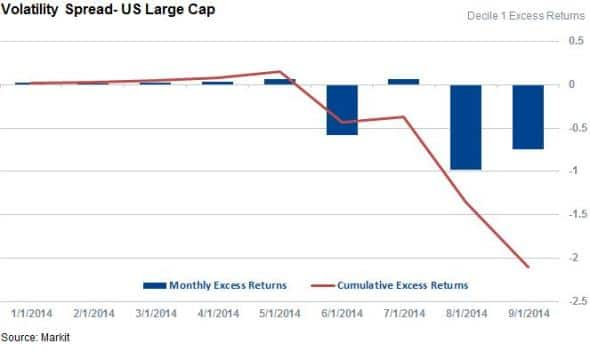
The strong historical performance looks to have taken a pause in recent months however as the top ranked decile in the US largecap universe has seen trailed the rest of the universe by 2% in since the start of the year; one of the worst slumps since the 1997.

Implied volatility drives financials spread
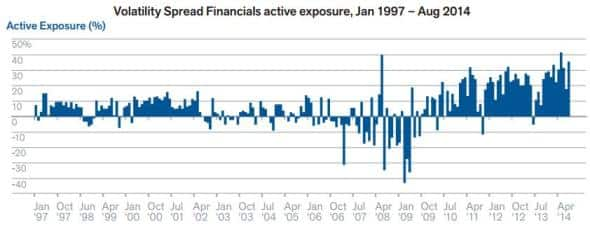
This slump in performance coincides with a surge in the proportion of financial firms amongst the 10% of shares with the highest volatility spread. This implies that financials have seen a dislocation between implied volatility expectations and those realised in the market. The sector now makes up 40% of the highest volatility spread decile, twice its representation amongst the overall universe. Two years ago, financials saw an even representation of their shares among the group of shares with the highest volatility spread.

This recent dislocation between the two volatility measures is driven by the fact that financials have seen a large spike in options implied volatility in the since the financial crisis. The surge in implied volatility was also reflected in realised market volatility in the wake of the crisis, a trend that has since subsided. Essentially, the options market has been pricing volatility into financial shares over the last couple of years that has failed to materialise.
While it has historically been a sign of positive future returns. the recent jump in volatility spread amongst financials has come at a time when the sector is on track to underperform the market for the first time in three years. The S&P 500 financials sector index has returned 5.5% year to date, 2% less than the overall index return.
Simon Colvin, Research Analyst at Markit
Posted 25 September 2014
S&P Global provides industry-leading data, software and technology platforms and managed services to tackle some of the most difficult challenges in financial markets. We help our customers better understand complicated markets, reduce risk, operate more efficiently and comply with financial regulation.
This article was published by S&P Global Market Intelligence and not by S&P Global Ratings, which is a separately managed division of S&P Global.
{"items" : [
{"name":"share","enabled":true,"desc":"<strong>Share</strong>","mobdesc":"Share","options":[ {"name":"facebook","url":"https://www.facebook.com/sharer.php?u=http%3a%2f%2fprod.azure.ihsmarkit.com%2fmarketintelligence%2fen%2fmi%2fresearch-analysis%2f25092014-equities-financials-volatility-fails-to-materialise.html","enabled":true},{"name":"twitter","url":"https://twitter.com/intent/tweet?url=http%3a%2f%2fprod.azure.ihsmarkit.com%2fmarketintelligence%2fen%2fmi%2fresearch-analysis%2f25092014-equities-financials-volatility-fails-to-materialise.html&text=Financials%27+volatility+fails+to+materialise","enabled":true},{"name":"linkedin","url":"https://www.linkedin.com/sharing/share-offsite/?url=http%3a%2f%2fprod.azure.ihsmarkit.com%2fmarketintelligence%2fen%2fmi%2fresearch-analysis%2f25092014-equities-financials-volatility-fails-to-materialise.html","enabled":true},{"name":"email","url":"?subject=Financials' volatility fails to materialise&body=http%3a%2f%2fprod.azure.ihsmarkit.com%2fmarketintelligence%2fen%2fmi%2fresearch-analysis%2f25092014-equities-financials-volatility-fails-to-materialise.html","enabled":true},{"name":"whatsapp","url":"https://api.whatsapp.com/send?text=Financials%27+volatility+fails+to+materialise http%3a%2f%2fprod.azure.ihsmarkit.com%2fmarketintelligence%2fen%2fmi%2fresearch-analysis%2f25092014-equities-financials-volatility-fails-to-materialise.html","enabled":true}]}, {"name":"rtt","enabled":true,"mobdesc":"Top"}
]}


