Customer Logins
Obtain the data you need to make the most informed decisions by accessing our extensive portfolio of information, analytics, and expertise. Sign in to the product or service center of your choice.
Customer Logins
BLOG
Jun 25, 2019
2019 U.S. Credit Halftime Preview

With the first half of 2019 nearly in the books, Nick Godec dives into our credit and bond indices data to provide a year-to-date glimpse of H1 U.S. Credit Market performance.
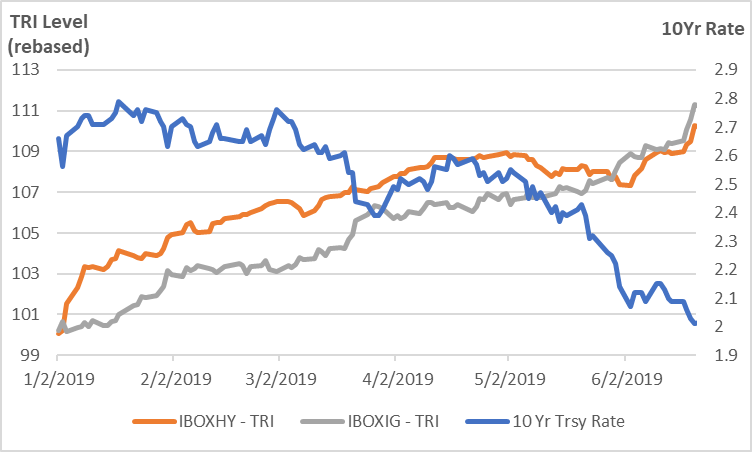
USD high yield and investment grade corporate bonds delivered strong year-to-date returns, with the iBoxx $ Liquid High Yield Index up 10.29% and the iBoxx $ Liquid Investment Grade Index up 11.28% as of June 20th, 2019. The rally in the Treasury curve drove fixed income performance as the Treasury 10-year rallied 65 basis points from 2.66% to 2.01%.
Figure1: USD HY & IG YTD return
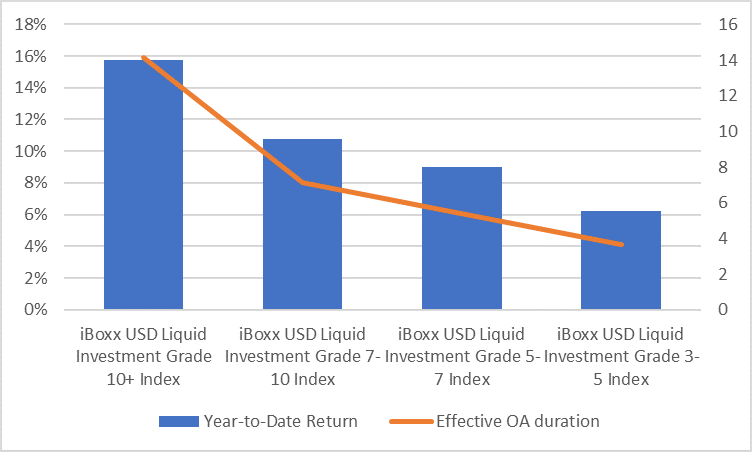
In both HY and IG, the greater the duration the greater the reward, with each increment of longer maturity providing more return:
Figure2: IBOXHY return per maturity bucket
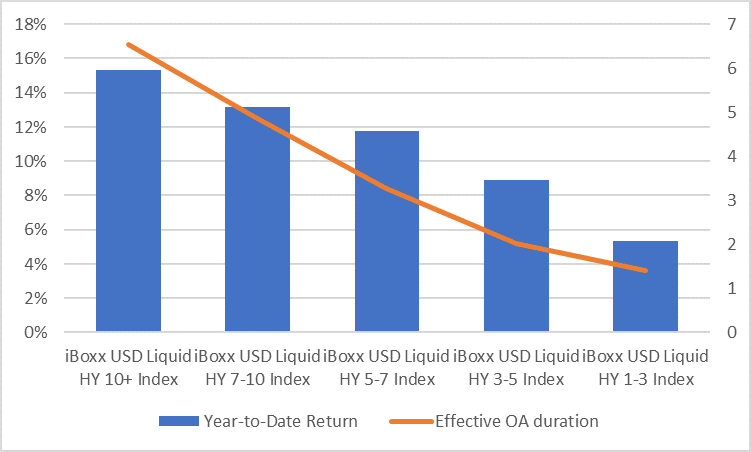
Figure3: BOXIG return per maturity bucket
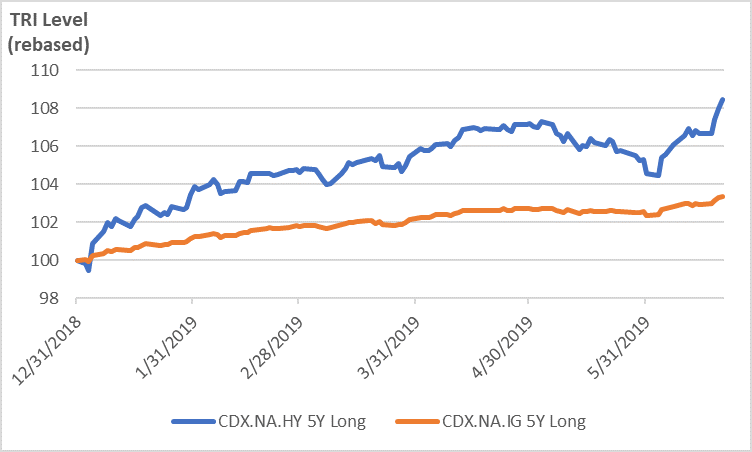
In high yield, credit positioning was also an important performance driver. Being long the 5-year on-the-run CDX High Yield Index returned 8.44% YTD versus 3.37% from the CDX Investment Grade Index.
Figure4: CDX HY & IG YTD Total Return
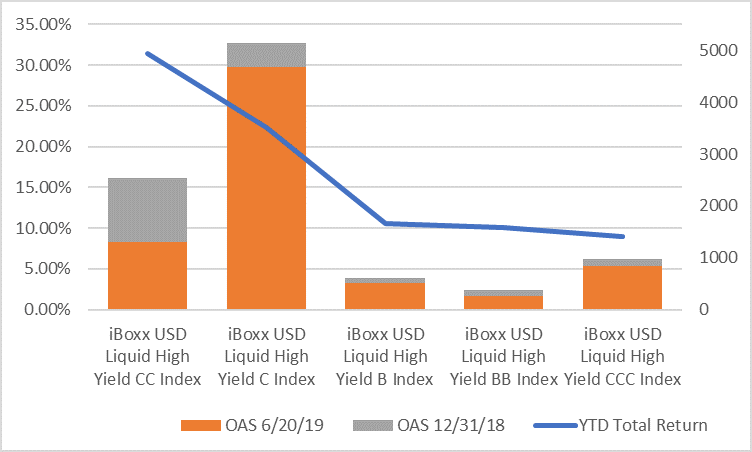
Lower-rated HY credit buckets outperformed, with the CC-rated and C-rated indices returning 31.4% and 22.38%, respectively, on 1,224 and 454 basis point tightening. B and BB-rated bonds delivered near HY index-matching return of 10.54% and 10.05%, respectively, while the lowest CCC-rated bucket underperformed with an 8.95% return.
Figure 5: IBOXHY credit return
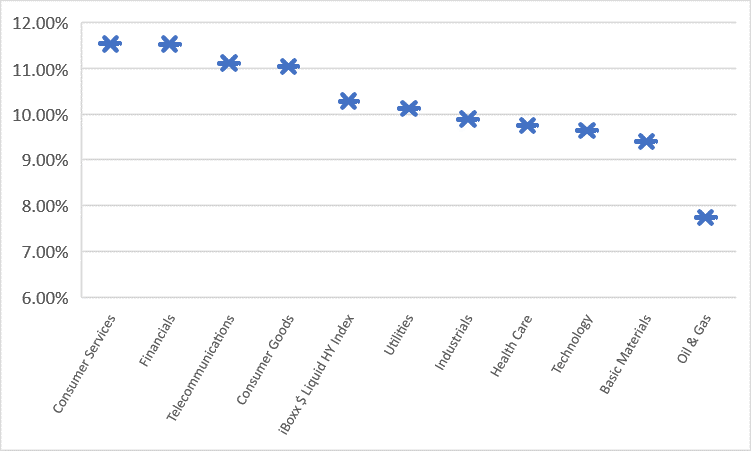
High yield saw little dispersion in sector returns except for Energy, which underperformed the HY Index by 2.55%.
Figure6: HY Sector YTD performance
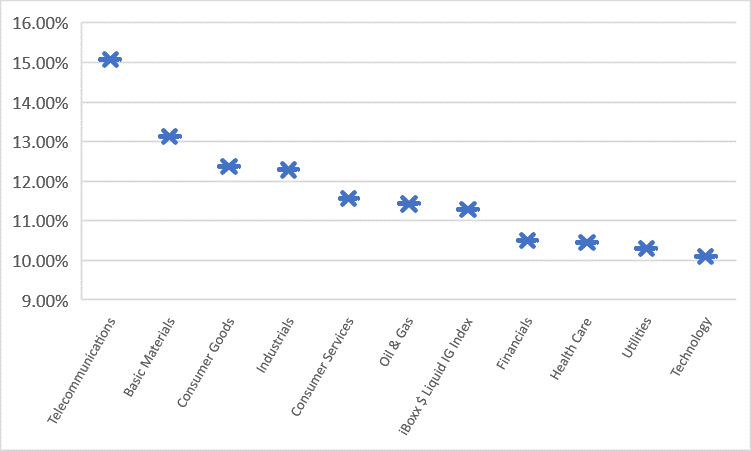
Telcom drove YTD performance in investment grade, delivering 3.79% above the IG Index. The Telcom sector began the year with the second highest annual yield (5.12% vs Consumer Goods 5.14%) and second highest effective duration (10.15 years vs Utilities 11 years). Telcom's effective duration began the year over 2 years longer than Consumer Goods.
Figure7: IG Sector YTD performance
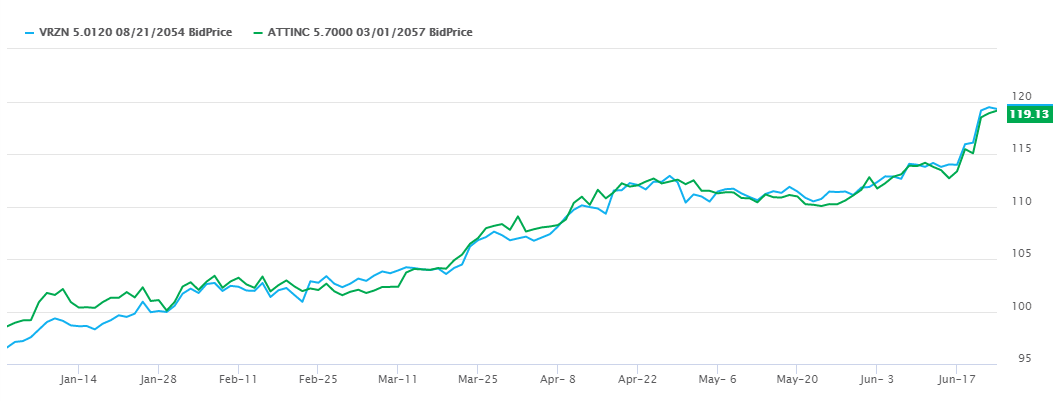
Verizon Communications Inc. and AT&T Inc. bonds had the great returns while also contributing the most to index return. VZ and AT&T have a combined $140.6bn of market value debt in the index. As a reference point, the highest returning Verizon and AT&T bonds were VZ 5.012% 8/21/2054 (ISIN: US92343VCM46) and T 5.70% 3/1/2057 (ISIN: US00206RDT68), which returned 25.55% and 22.04%, respectively.
Figure 8: VZ 5.012% 8/21/2054 vs T 5.70% 3/1/2057
S&P Global provides industry-leading data, software and technology platforms and managed services to tackle some of the most difficult challenges in financial markets. We help our customers better understand complicated markets, reduce risk, operate more efficiently and comply with financial regulation.
This article was published by S&P Global Market Intelligence and not by S&P Global Ratings, which is a separately managed division of S&P Global.
{"items" : [
{"name":"share","enabled":true,"desc":"<strong>Share</strong>","mobdesc":"Share","options":[ {"name":"facebook","url":"https://www.facebook.com/sharer.php?u=http%3a%2f%2fprod.azure.ihsmarkit.com%2fmarketintelligence%2fen%2fmi%2fresearch-analysis%2f2019-us-credit-halftime-preview.html","enabled":true},{"name":"twitter","url":"https://twitter.com/intent/tweet?url=http%3a%2f%2fprod.azure.ihsmarkit.com%2fmarketintelligence%2fen%2fmi%2fresearch-analysis%2f2019-us-credit-halftime-preview.html&text=2019+U.S.+Credit+Halftime+Preview+%7c+S%26P+Global+","enabled":true},{"name":"linkedin","url":"https://www.linkedin.com/sharing/share-offsite/?url=http%3a%2f%2fprod.azure.ihsmarkit.com%2fmarketintelligence%2fen%2fmi%2fresearch-analysis%2f2019-us-credit-halftime-preview.html","enabled":true},{"name":"email","url":"?subject=2019 U.S. Credit Halftime Preview | S&P Global &body=http%3a%2f%2fprod.azure.ihsmarkit.com%2fmarketintelligence%2fen%2fmi%2fresearch-analysis%2f2019-us-credit-halftime-preview.html","enabled":true},{"name":"whatsapp","url":"https://api.whatsapp.com/send?text=2019+U.S.+Credit+Halftime+Preview+%7c+S%26P+Global+ http%3a%2f%2fprod.azure.ihsmarkit.com%2fmarketintelligence%2fen%2fmi%2fresearch-analysis%2f2019-us-credit-halftime-preview.html","enabled":true}]}, {"name":"rtt","enabled":true,"mobdesc":"Top"}
]}