Volatility impact

With volatility recording the largest monthly increase this year in US markets and the S&P 500 posting its worst week in two years, we take a look at factors most impacted by rising volatility from the perspective of underperformance.
- The VIX was up 34% for the week as S&P 500 shares dropped 2.7%
- Price reversal metrics consistently underperform in times of rising volatility
- Energy names are prevalent among the list poised to underperform based on price reversal metrics
Last week was tough for US equity markets on unclear economic data and its implications on Fed policy, a hotbed of geopolitical disputes and financial concerns in Argentina. S&P 500 shares finished the week down 2.7%, the worst since June 2012 and flirting with key support levels.
Investors are left worrying if the market got ahead of itself, questioning if this is just an overdue correction or the beginning of a bear market.
Given that markets have been resting in a low volatility environment since mid-2012, we recently addressed the implications of spikes in volatility on factor performance following a report by Markit Research Signals looking into prior volatility shock regimes (a full copy of the report can be found here).
Our previous commentary spotlighted risk factors which perform well in times when the VIX sees a 10% or more surge in month-on-month volatility, with 60-day residual risk prominent among the list.
Growth and estimate revisions lag
We turn now to the other end of the performance spectrum and consider those signals which consistently underperform in high volatility environments across the US Large Cap universe.
Growth factors tend to underperform as expected because a rise in volatility should increase the discount rate, leading to underperformance in growth stocks. Likewise, estimate revisions metrics underperform on average as the frequency of estimate revisions and magnitude of variation from mean estimates is expected to increase in volatile macro environments, thus suggesting that investors may, in turn, discount the information content of the signal.
Price reversal suffers the most
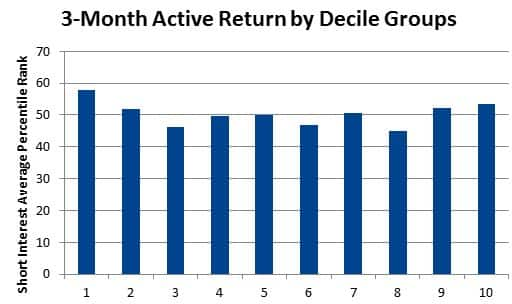
However, as volatility moves to more extreme levels, price reversal measures are more prominent underperformers. In particular, we highlight 3-Month Active Return, measuring the 3-month market-adjusted return on a stock.
Since January 2000, the factor has seen the 10% most attractive reversal candidates underperform the least attractive names by 5.6% in months of extreme volatility. This makes it the worst performing factor during such periods. The factor's strong negative performance is driven by extended downside for shares with near-term negative active returns in highly volatile times, rather than the reversal feature expected of such shares in trending markets.
Yet, in July the factor's top versus bottom decile return spreads, while retreating from June levels (2.4%), remained in positive territory for the month (0.8%). Thus, we expect this trend to reverse.
We further observe that the top 10% of names by the 3-Month Active Return are the most negatively exposed to short interest, recording an average percentile rank of 58 (a rank of 100 indicates the highest short interest).
Energy stocks lead reversal candidates
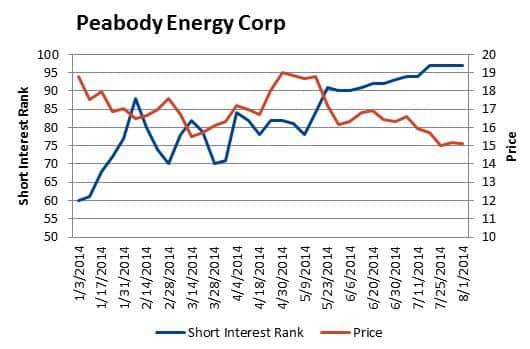
Furthermore, of the names in the top 10% ranks for 3-Month Active Return, the largest sector representation is Energy, where 23% of the overall large cap constituents are included in the list. Of these Energy firms, the most shorted stocks include Diamond Offshore Drilling Inc, Peabody Energy Corp, Sandridge Energy Inc and Ultra Petroleum Corp.
Peabody Energy has seen its short interest percentile rank deteriorate by the most, moving from 60 at the start of the year to 97 as of the latest reading.
As one of the world's largest coal companies, the company has been plagued by cheap coal from offshore exporting countries, in a contracting industry compounded by low natural gas prices, federal regulations and expectations for slowing Chinese demand. Its share price has dropped by approximately 20% for the year, nearly ten-fold that seen for the coal industry average within the coverage universe.
Karen Wurdack
Analyst
Markit
S&P Global provides industry-leading data, software and technology platforms and managed services to tackle some of the most difficult challenges in financial markets. We help our customers better understand complicated markets, reduce risk, operate more efficiently and comply with financial regulation.
This article was published by S&P Global Market Intelligence and not by S&P Global Ratings, which is a separately managed division of S&P Global.