Customer Logins
Obtain the data you need to make the most informed decisions by accessing our extensive portfolio of information, analytics, and expertise. Sign in to the product or service center of your choice.
Customer Logins
BLOG
Apr 30, 2020
US Retail Sales vs Container Shipping - Exploring the Relationship

A recent area of interest following the coronavirus pandemic is analysing the various market segments to understand not only how the market might develop, but also understanding the relationships between the suppliers and consumers. IHS Markit has recently undertaken a study on the US market to see if such a relationship can be identified and quantified.
IHS Markit US Bill of Lading data is ingested daily, containing invaluable insights into market evolution. The tagging of containerised goods makes this an ideal data set to use when conducting container shipping analysis, as it's typically timelier than other census or statistical data that is released. The richness of the data also allows for further analysis by commodity/market segment, shipper/consignee, port/country to understand how each of these impacts the consumer market.
US retail sales vs US imports of containerised goods
Data between January 2012 and March 2020 at a monthly frequency was analysed. The 96 periods showed a 0.82R2 (Correlation coefficient) demonstrating how the US total retail values are related to US imports of containerised goods, and that as the imports of MTONS/TEU increases, the number of total retails sales also increases.
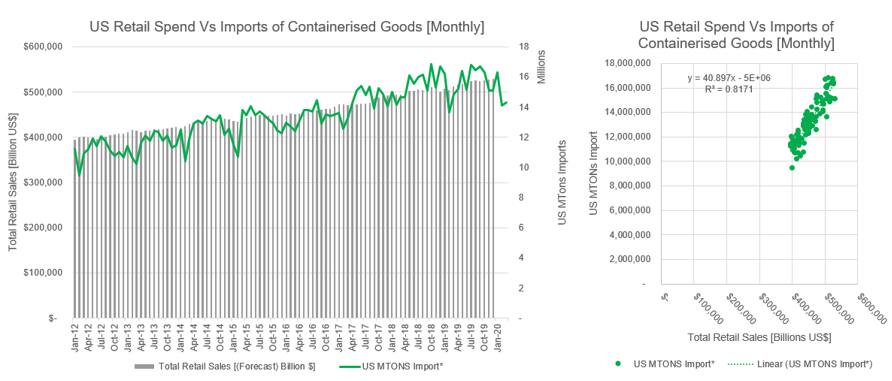
Figure 1: US retail sales vs US imports of containerised goods. Source IHS Markit PIERS and IHS Markit US Economy
With one week left of April, US imports of containerised volumes stands at a little under 1.5M TEUs* which represents 81% of the 5Y average (We typically have 73% of volume for the previous month (i.e. April) on the first day of the month (i.e. May)). Looking at historical tendencies, April is in many ways an indication of what import activity will look like for the year ahead, as it is usually when we start to see growth within the calendar year (+5% increase between March and April).
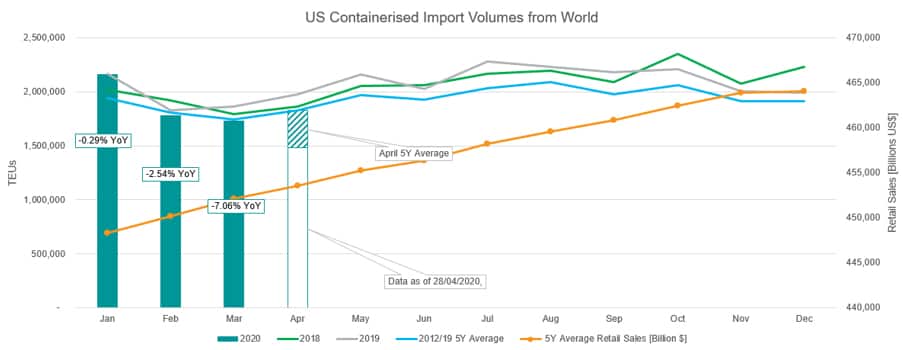
Figure 2: US imports of containerised volumes YTD, as of 27th April 2020 with year-on-year change. Source IHS Markit PIERS and IHS Markit US Economy
We can see increases in shipments prior to major retail events taking place in September with Labour Day, as well as November and December in anticipation of Black Friday and Christmas, and further analysis could potentially be done in terms of seeing how volume subsequently results in retail sales, as well as potentially understanding safety stock. With the data both containing a weekly and a daily field - one could further analyse it to better understand the volatility and risk of supply chains.
{"items" : [
{"name":"share","enabled":true,"desc":"<strong>Share</strong>","mobdesc":"Share","options":[ {"name":"facebook","url":"https://www.facebook.com/sharer.php?u=http%3a%2f%2fprod.azure.ihsmarkit.com%2fmarketintelligence%2fen%2fmi%2fresearch-analysis%2fus-retail-sales-v-container-shipping-exploring-relationship.html","enabled":true},{"name":"twitter","url":"https://twitter.com/intent/tweet?url=http%3a%2f%2fprod.azure.ihsmarkit.com%2fmarketintelligence%2fen%2fmi%2fresearch-analysis%2fus-retail-sales-v-container-shipping-exploring-relationship.html&text=US+Retail+Sales+vs+Container+Shipping+-+Exploring+the+Relationship+%7c+S%26P+Global+","enabled":true},{"name":"linkedin","url":"https://www.linkedin.com/sharing/share-offsite/?url=http%3a%2f%2fprod.azure.ihsmarkit.com%2fmarketintelligence%2fen%2fmi%2fresearch-analysis%2fus-retail-sales-v-container-shipping-exploring-relationship.html","enabled":true},{"name":"email","url":"?subject=US Retail Sales vs Container Shipping - Exploring the Relationship | S&P Global &body=http%3a%2f%2fprod.azure.ihsmarkit.com%2fmarketintelligence%2fen%2fmi%2fresearch-analysis%2fus-retail-sales-v-container-shipping-exploring-relationship.html","enabled":true},{"name":"whatsapp","url":"https://api.whatsapp.com/send?text=US+Retail+Sales+vs+Container+Shipping+-+Exploring+the+Relationship+%7c+S%26P+Global+ http%3a%2f%2fprod.azure.ihsmarkit.com%2fmarketintelligence%2fen%2fmi%2fresearch-analysis%2fus-retail-sales-v-container-shipping-exploring-relationship.html","enabled":true}]}, {"name":"rtt","enabled":true,"mobdesc":"Top"}
]}