Customer Logins
Obtain the data you need to make the most informed decisions by accessing our extensive portfolio of information, analytics, and expertise. Sign in to the product or service center of your choice.
Customer Logins
Sep 13, 2018
Trade Policy Insights: China Soybeans Challenge
Author: Daniela Stratulativ, Associate Director, Global Trade | Maritime & Trade
Key points:
- US Exports reached 1.5 trillion USD in 2017. China is the 3rd largest US Export market, by value, after Canada and Mexico. US Exports to China increased by 12.4% in 2017, to 130 billion USD.
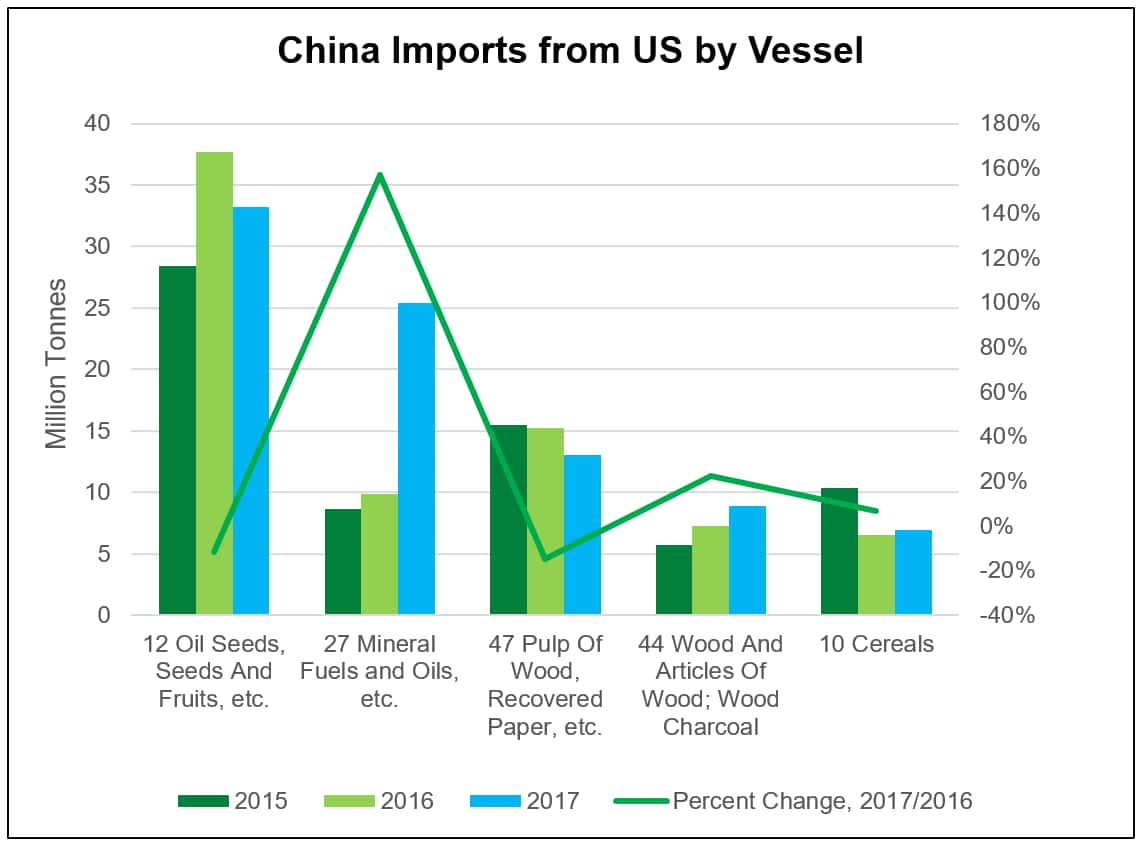
- China highest seaborne imports from US by volume are oil seeds - including soybeans, mineral fuels, wood, and cereals.
- China soybeans imports reached 95 million tonnes in 2017, of which 33 million from US.
- Major soybeans producers other than US export 20 million tonnes outside China, not enough now to replace US exports.
Rules of US China trade
US - China trade relations are governed by the WTO rules. WTO has 164 members and over 20 accessions in progress. Member countries are free to negotiate bilateral, plurilateral, regional trade agreements. Preferential trade agreements provide additional layers of tariff reductions and other benefits.
Under WTO agreements, members have to treat all other members equally regarding tariffs: the Most Favoured Nation (MFN) rule. In addition, member countries have to treat imported products as domestic products in the application of sales tax, otherwise, sales tax could be a form of duty on imports.
Under certain circumstances members can deny the MFN treatment to other members. China has been a WTO member since 2001.
US China Trade - by Value, Volume, Mode of Transport
China imports from US are increasing at a higher rate than exports to US: in value 12.3% vs 9.3%, in quantity 8.8% vs 6%. China exports to US are almost 4 times higher in value than US Exports to China. In 2017, US imports from China reached nearly 70 million tonnes and over 505 bn USD, while China imports from US reached 104 million tonnes and close to 130 bn USD.

Source: IHS Markit © 2018 IHS Markit
Soybeans imports
Oil seeds - including soybeans are China highest seaborne imports by volume, followed by mineral fuels, wood, and cereals.

Source: IHS Markit © 2018 IHS Markit
How tariffs could affect China imports of US Soybeans

Source: IHS Markit © 2018 IHS Markit
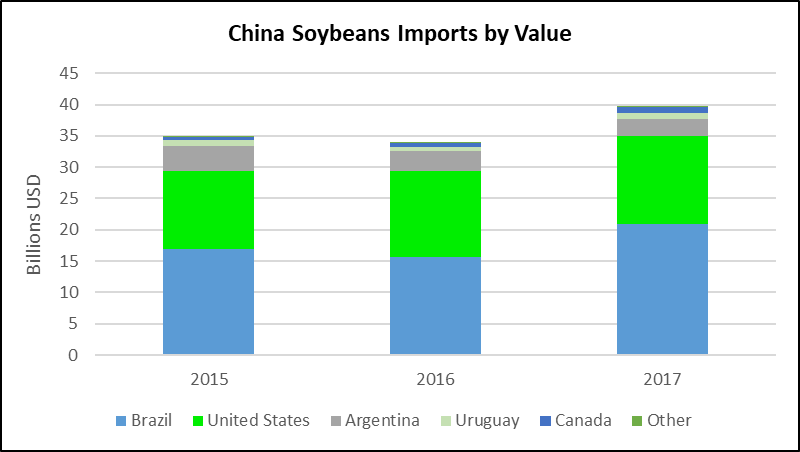
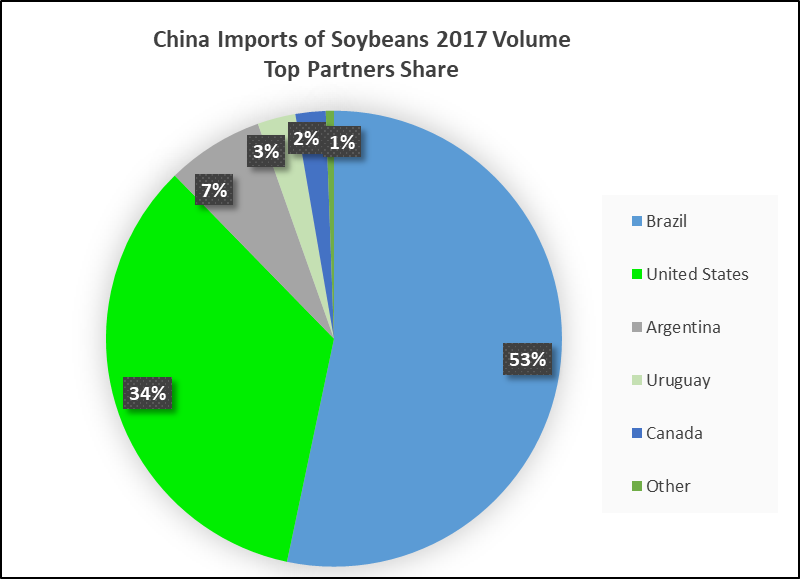
China imported 95 million tonnes of soybeans in 2017. Imports from Brazil totaled 51 million tonnes, accounting for 53% and US 33 million tonnes, a share of 34% of Chinese soybeans imports.

Source: IHS Markit © 2018 IHS Markit
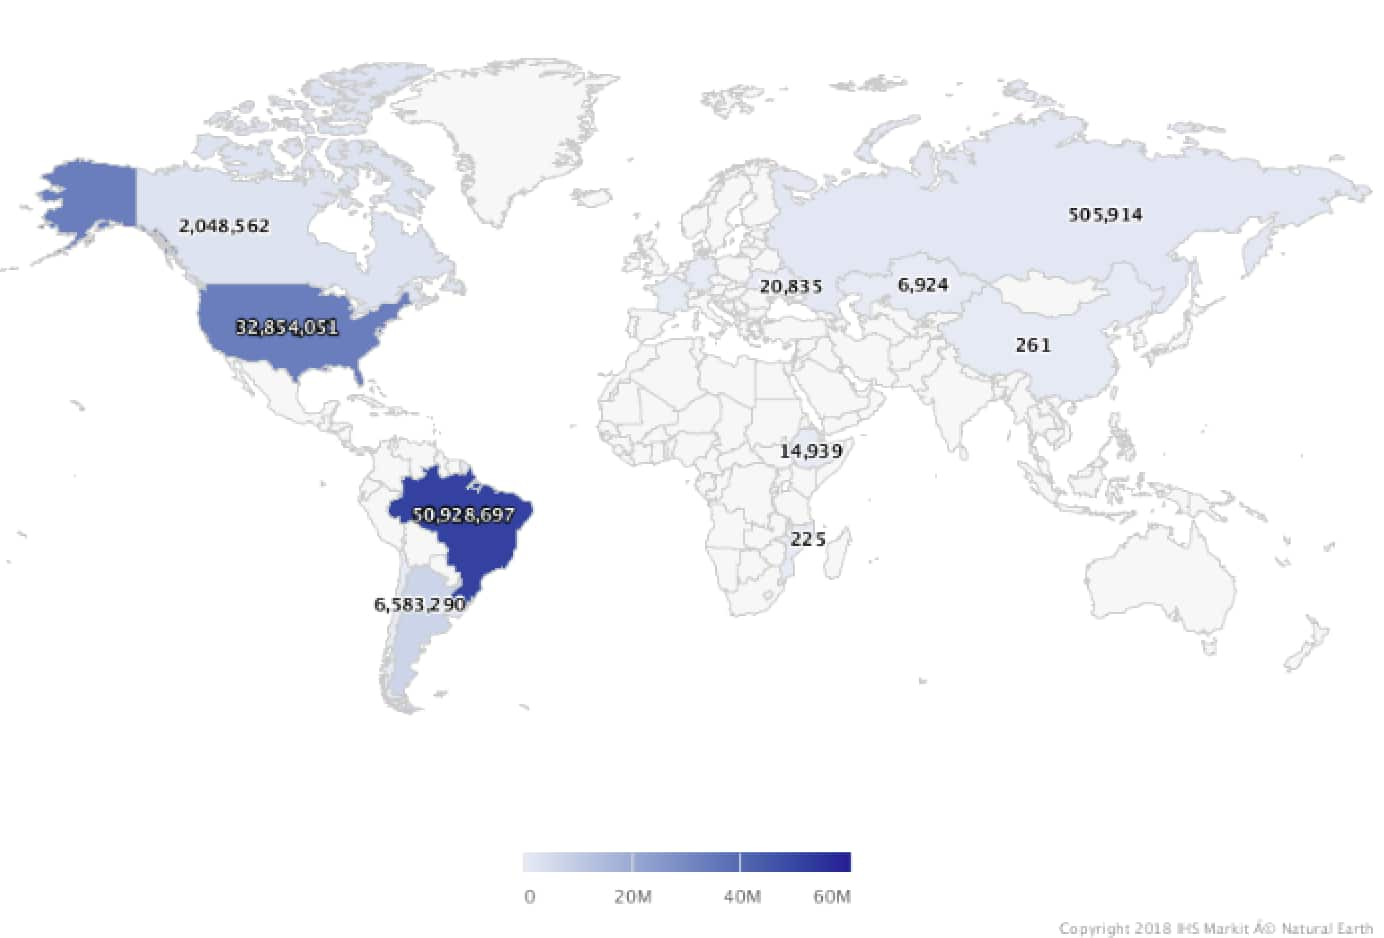
China Imports of Soybeans 2017 Tonnes:
Source: IHS Markit © 2018 IHS Markit
China alternatives for US soybeans:
The top exporters of soybeans in 2017 were Brazil, Argentina, Uruguay and Canada, with total exports of soybeans to other partners than China of 20 million tonnes: Brazil 14.3 million tonnes, Argentina 1 million, Uruguay 2 million, Canada 2.7 million tonnes.
The imports of US soybeans of 33 million tonnes could not be replaced now by imports from other countries since the available supply is only 20 million tonnes. China could decide to decrease demand by using other agricultural products as substitutes.
Research based on value and volumes of product:
HS code 12 (Oil Seeds And Oleaginous Fruits; Miscellaneous Grains, Seeds And Fruits; Industrial Or Medicinal Plants; Straw And Fodder), referenced in the article as oil seeds.
HS code 1201 (Soybeans, Whether Or Not Broken), referenced in the article as soybeans.
This column is based on data from IHS Markit:
{"items" : [
{"name":"share","enabled":true,"desc":"<strong>Share</strong>","mobdesc":"Share","options":[ {"name":"facebook","url":"https://www.facebook.com/sharer.php?u=http%3a%2f%2fprod.azure.ihsmarkit.com%2fmarketintelligence%2fen%2fmi%2fresearch-analysis%2ftrade-policy-insights-china-soybeans-challenge.html","enabled":true},{"name":"twitter","url":"https://twitter.com/intent/tweet?url=http%3a%2f%2fprod.azure.ihsmarkit.com%2fmarketintelligence%2fen%2fmi%2fresearch-analysis%2ftrade-policy-insights-china-soybeans-challenge.html&text=Trade+Policy+Insights%3a+China+Soybeans+Challenge+%7c+S%26P+Global+","enabled":true},{"name":"linkedin","url":"https://www.linkedin.com/sharing/share-offsite/?url=http%3a%2f%2fprod.azure.ihsmarkit.com%2fmarketintelligence%2fen%2fmi%2fresearch-analysis%2ftrade-policy-insights-china-soybeans-challenge.html","enabled":true},{"name":"email","url":"?subject=Trade Policy Insights: China Soybeans Challenge | S&P Global &body=http%3a%2f%2fprod.azure.ihsmarkit.com%2fmarketintelligence%2fen%2fmi%2fresearch-analysis%2ftrade-policy-insights-china-soybeans-challenge.html","enabled":true},{"name":"whatsapp","url":"https://api.whatsapp.com/send?text=Trade+Policy+Insights%3a+China+Soybeans+Challenge+%7c+S%26P+Global+ http%3a%2f%2fprod.azure.ihsmarkit.com%2fmarketintelligence%2fen%2fmi%2fresearch-analysis%2ftrade-policy-insights-china-soybeans-challenge.html","enabled":true}]}, {"name":"rtt","enabled":true,"mobdesc":"Top"}
]}


