Tender Option Bonds: Performance 2019
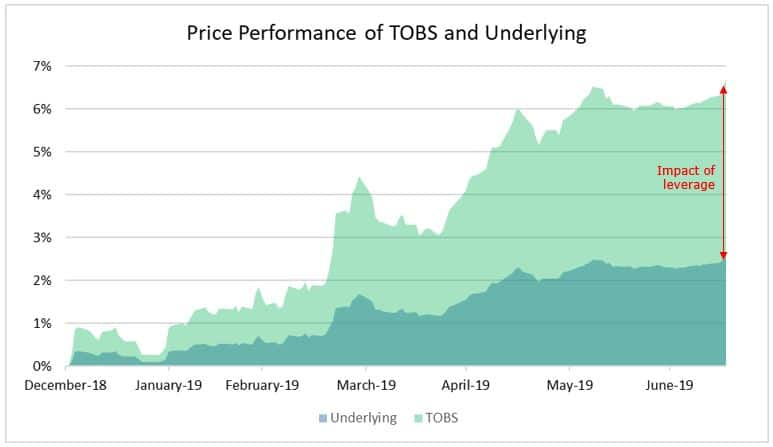
The municipal bond market has had an exceptional year, recently surpassing $4 trillion. Ten- year and 30-year IHS Markit AAA municipal bond benchmark yields have compressed from 2.31% and 3.05% respectively on December 31, 2018 to 1.56% and 2.33% as of July 23, 2019. With this environment, we examined the performance of Tender Option Bonds (TOBs), observing how their leverage causes TOBs price returns to amplify.
What are Tender Option Bonds (TOBs)?
The structure of a TOB:
- One or more underlying bonds that are high quality municipal bonds (Investment Grade bonds)
- Floaters with weekly / monthly resets (with low coupons)
- TOBs issued for the residual portion are generally levered 3x to 5x
TOBS get excess returns based on performance of underling securities after making payments to floaters.

Above: Illustrative example of Price Return on a composite of ~250 TOBS with 3x Leverage and their underlying securities
Why has performance been strong in 2019?
- Compressing Yields in the Municipal bond market overall
- Underlying Credits with improved credit health
- Low borrowing costs
- General low supply of underlying bonds
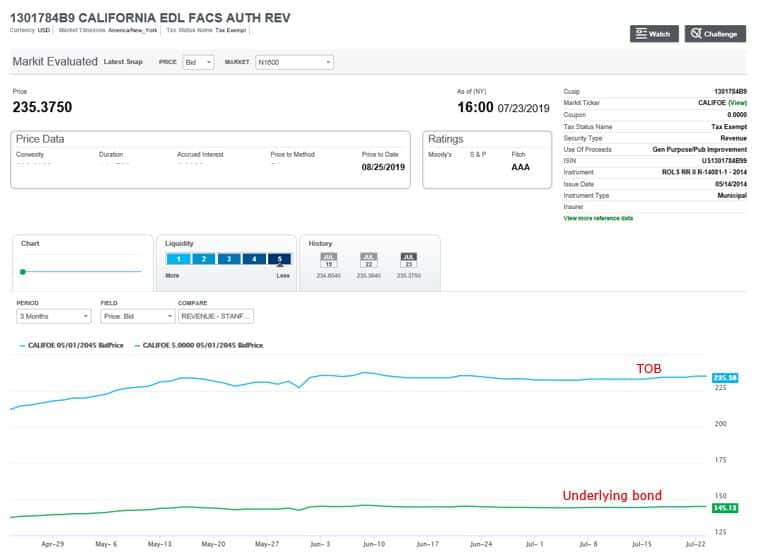
Sample TOB with 3x Leverage and its Underlying

Source: IHS Markit Price Viewer
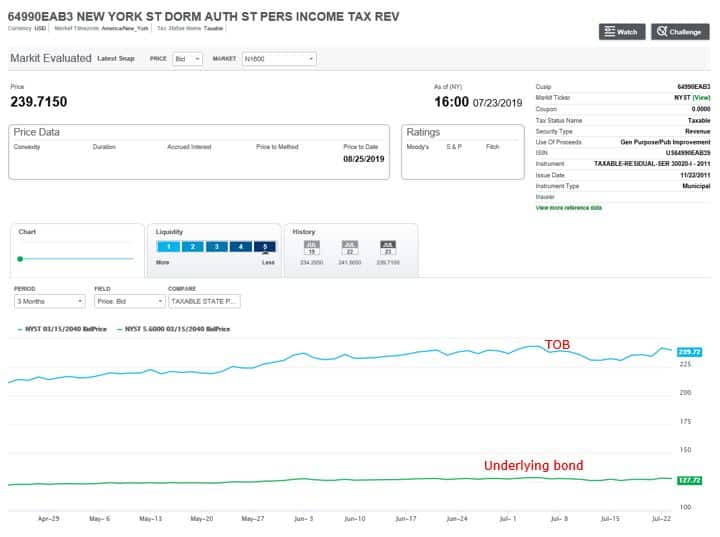
Sample TOB with 5x Leverage and its Underlying
 Source: IHS Markit Price Viewer
Recent Related Content
Municipal Bonds Focus on Illinois - May 2019
Municipal Bonds - April 2019 Highlights
S&P Global provides industry-leading data, software and technology platforms and managed services to tackle some of the most difficult challenges in financial markets. We help our customers better understand complicated markets, reduce risk, operate more efficiently and comply with financial regulation.
This article was published by S&P Global Market Intelligence and not by S&P Global Ratings, which is a separately managed division of S&P Global.
