Customer Logins
Obtain the data you need to make the most informed decisions by accessing our extensive portfolio of information, analytics, and expertise. Sign in to the product or service center of your choice.
Customer Logins
ECONOMICS COMMENTARY
Dec 11, 2024
PMI survey response rates: Survey response rates continue to average 73%, in line with pre-pandemic averages

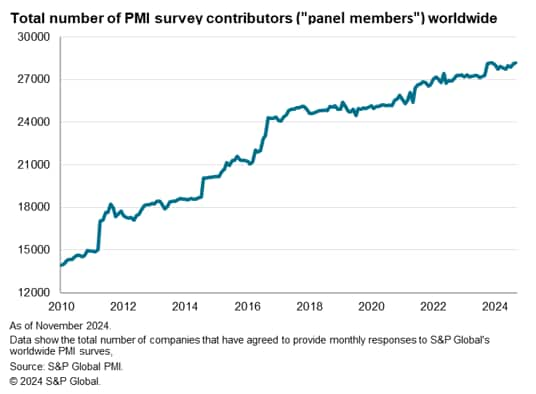
The total number of S&P Global PMI survey panels has risen from just one in 1992 to 70 at present, with more panels currently being constructed. At the same time, the total number of survey contributors participating in S&P Global survey panels has risen to an all-time high of over 28,000, with response rates running at 73%, broadly in line with the survey's pre-pandemic average, albeit below the highs seen during the pandemic.
70 PMI survey panels
S&P Global currently produces PMI surveys in some 40 countries worldwide, comprising 70 individual survey panels. Each panel covers either manufacturing, services, construction or - in a smaller number of cases - the whole economy. For each survey, the panel is carefully designed to accurately represent the true structure of the actual economy (or sector) according to official data. Companies are invited to participate in the surveys with this recruitment process closely monitored in order to ensure accurate mapping of the survey according to the official (government) data relating to sub-sector and company size contributions to economic output (as measured by gross value added).

A comprehensive list of the survey panels and countries covered by S&P Global PMIs is provided in the Appendix.
28K PMI panel members
The 70 PMI survey panels contain just over 28,000 company respondents, who have agreed to provide monthly data to the PMI surveys on an ongoing basis. These respondents are generally high-level executives, commonly drawn from purchasing functions in the manufacturing sector but representing a broader mix of job functions in the services economy, notably including finance, sales, marketing, or other C-suite executives. This reflects the fact that purchasing functions are less crucial or integral to the core business activities of many services companies compared to manufacturing.
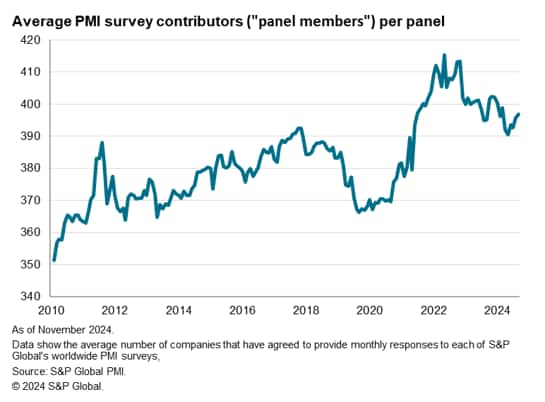
396 average survey responses per month
Not all of these 28K survey participants respond each month, with some respondents unable to participate from time to time due to illness or other factors. However, S&P Global offers good incentives to participation, including a variety of economic research, reports and intelligence, which ensures high participation. The 70 PMI survey panels see an average of just under 400 responses received each month over the course of the year. Response rates can differ through the year, with holiday seasons in particular typically seeing below par response patterns. Also note that not all panels are the same size: larger economies tend to have panel sizes larger than the average. Each panel size is noted on the press release for reach survey.
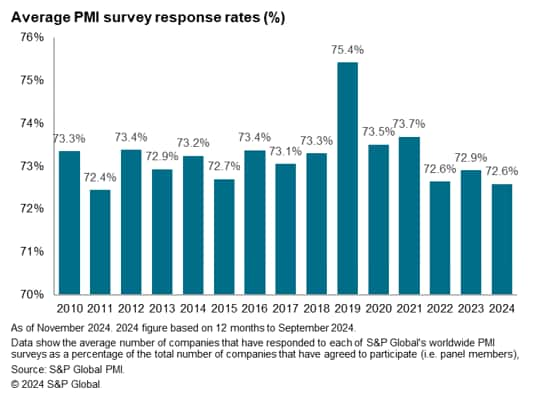
73% response rate
The survey respondents represent an average response rate of 73% (in fact 72.6%) over the latest 12 months covering October 2023 to September 2024. That's down from an annual average high of 75% achieved in 2019, and especially elevated response rates seen during the pandemic, but is in line with the average of 73% achieved between 2010 and 2018.
Encouraging participation
At a time when concerns are growing over the quality of official economic data, with widespread accounts of difficulties in encouraging companies to participate in surveys for the collection of data such as gross domestic product (GDP) and payrolls, we look at how survey incentives have helped sustain high levels of participation in the PMI surveys
First, who typically fills in the PMI questionnaires? Questions are sometimes raised as to the quality of survey respondents, as busy executives are likely to rarely find time to accurately complete questionnaires. In the case of S&P Global's PMI surveys, we ensure that, from an economics perspective, completing the questionnaires is very appealing to potential respondents. A factor which makes the PMI survey methodology different from official economic data surveys, conducted by governments, is that participating in the PMI includes a strong value proposition, which we refer to as our 'give-get' model.
In practice, a survey works best if participants get something back that they value as a reward for the contribution they give. For the PMI surveys, respondents receive no monetary reward for participating in the surveys, but they are given access to the survey results. In fact, respondents don't just get their own industry report summary, but also have access to reports on their customer and supplier markets, often on both a geographical and industry/sector basis.
We know from our research that the PMI respondents value this information. This became especially evident during the pandemic, when companies were struggling to find reliable economic data and business guidance at a time of great uncertainty. Our research into the survey participation by companies indicates how the majority of survey participants use the PMI reports provided back to them in their own business decision making, whether it's for benchmarking sales performance relative to peers, forecasting revenues, making investment or other spending decisions, or negotiating with suppliers and customers. Here's an example from a UK-based manufacturer who participates in the PMI:
"The survey reports are useful to our business in a number of ways. Firstly, it reaffirms our own findings on how input prices on certain materials are being affected. This gives us some confidence that competitors are likely to feel the effects also and shows what factors are actually creating the increases.
"This then tells us how knowledgeable our agents and suppliers are, and whether they are supporting any negotiations on actual events rather than just seeing an opportunity to get more money for raw materials. It also gives me a bargaining tool when I can assess if impacts are long or short term.
"It is also useful to see the growth areas within world economies. Our sales force can target those areas to see if we can gain some of the wealth, or alternatively compare if our industry is growing in the same countries at similar rates. Whilst we do get informed on business developments and growth within our group, the information can sometimes have a positive slant more engineered by financial figures than economic activity. This obviously has a bearing on our own strategic thinking."
These days, PMI questionnaires can be completed very easily and quickly online, meaning just a few minutes' work are rewarded with valuable information that others typically may have to pay for.
Participation rates have improved since the 1990s and 2000s with the advent of email and internet-based data collection (and of course web-based distribution of survey rewards to panel members). Moreover, as the PMIs have become more global it means we can offer even greater incentives to contributors in terms of global economic reports and detailed sector-specific analysis of markets.
S&P Global PMI survey coverage
- Austria Manufacturing
- Australia Manufacturing
- Australia Services
- Brazil Manufacturing
- Brazil Services
- Canada Manufacturing
- Canada Services
- China (mainland) Manufacturing
- China (mainland) Services
- Colombia Manufacturing
- Czech Manufacturing
- Germany Construction
- Germany Manufacturing
- Germany Services
- Egypt Whole Economy
- Spain Manufacturing
- Spain Services
- France Construction
- France Manufacturing
- France Services
- Ghana Whole Economy
- Greece Manufacturing
- Hong Kong SAR Whole Economy
- Indonesia Manufacturing
- Ireland Construction
- Ireland Manufacturing
- Ireland Services
- India Manufacturing
- India Services
- Italy Construction
- Italy Manufacturing
- Italy Services
- Japan Manufacturing
- Japan Services
- Kenya Whole Economy
- South Korea Manufacturing
- Kuwait Whole Economy
- Kazakhstan Manufacturing
- Kazakhstan Services
- Lebanon Whole Economy
- Myanmar Manufacturing
- Mexico Manufacturing
- Malaysia Manufacturing
- Mozambique Whole Economy
- Netherlands Manufacturing
- Nigeria Whole Economy
- Northern Ireland Whole Economy
- Philippines Manufacturing
- Poland Manufacturing
- Qatar Whole Economy
- Romania Manufacturing
- Russia Manufacturing
- Russia Services
- Saudi Arabia Whole Economy
- Scotland Manufacturing
- Scotland Services
- Singapore Whole Economy
- South Africa Whole Economy
- Thailand Manufacturing
- Turkey Manufacturing
- Taiwan Manufacturing
- UAE Whole Economy
- Uganda Whole Economy
- UK Construction
- UK Manufacturing
- UK Services
- USA Manufacturing
- USA Services
- Vietnam Manufacturing
- Zambia Whole Economy
Chris Williamson, Chief Business Economist, S&P Global Market Intelligence
Tel: +44 207 260 2329
chris.williamson@spglobal.com
© 2024, S&P Global. All rights reserved. Reproduction in whole
or in part without permission is prohibited.
Purchasing Managers' Index™ (PMI®) data are compiled by S&P Global for more than 40 economies worldwide. The monthly data are derived from surveys of senior executives at private sector companies, and are available only via subscription. The PMI dataset features a headline number, which indicates the overall health of an economy, and sub-indices, which provide insights into other key economic drivers such as GDP, inflation, exports, capacity utilization, employment and inventories. The PMI data are used by financial and corporate professionals to better understand where economies and markets are headed, and to uncover opportunities.
This article was published by S&P Global Market Intelligence and not by S&P Global Ratings, which is a separately managed division of S&P Global.
{"items" : [
{"name":"share","enabled":true,"desc":"<strong>Share</strong>","mobdesc":"Share","options":[ {"name":"facebook","url":"https://www.facebook.com/sharer.php?u=http%3a%2f%2fprod.azure.ihsmarkit.com%2fmarketintelligence%2fen%2fmi%2fresearch-analysis%2fpmi-survey-response-rates-average-73-in-line-with-prepandemic-averages-Dec24.html","enabled":true},{"name":"twitter","url":"https://twitter.com/intent/tweet?url=http%3a%2f%2fprod.azure.ihsmarkit.com%2fmarketintelligence%2fen%2fmi%2fresearch-analysis%2fpmi-survey-response-rates-average-73-in-line-with-prepandemic-averages-Dec24.html&text=PMI+survey+response+rates%3a+Survey+response+rates+continue+to+average+73%25%2c+in+line+with+pre-pandemic+averages+%7c+S%26P+Global+","enabled":true},{"name":"linkedin","url":"https://www.linkedin.com/sharing/share-offsite/?url=http%3a%2f%2fprod.azure.ihsmarkit.com%2fmarketintelligence%2fen%2fmi%2fresearch-analysis%2fpmi-survey-response-rates-average-73-in-line-with-prepandemic-averages-Dec24.html","enabled":true},{"name":"email","url":"?subject=PMI survey response rates: Survey response rates continue to average 73%, in line with pre-pandemic averages | S&P Global &body=http%3a%2f%2fprod.azure.ihsmarkit.com%2fmarketintelligence%2fen%2fmi%2fresearch-analysis%2fpmi-survey-response-rates-average-73-in-line-with-prepandemic-averages-Dec24.html","enabled":true},{"name":"whatsapp","url":"https://api.whatsapp.com/send?text=PMI+survey+response+rates%3a+Survey+response+rates+continue+to+average+73%25%2c+in+line+with+pre-pandemic+averages+%7c+S%26P+Global+ http%3a%2f%2fprod.azure.ihsmarkit.com%2fmarketintelligence%2fen%2fmi%2fresearch-analysis%2fpmi-survey-response-rates-average-73-in-line-with-prepandemic-averages-Dec24.html","enabled":true}]}, {"name":"rtt","enabled":true,"mobdesc":"Top"}
]}