Customer Logins
Obtain the data you need to make the most informed decisions by accessing our extensive portfolio of information, analytics, and expertise. Sign in to the product or service center of your choice.
Customer Logins
BLOG
Nov 02, 2020
Insight into the global variation of mean export distance
Key findings
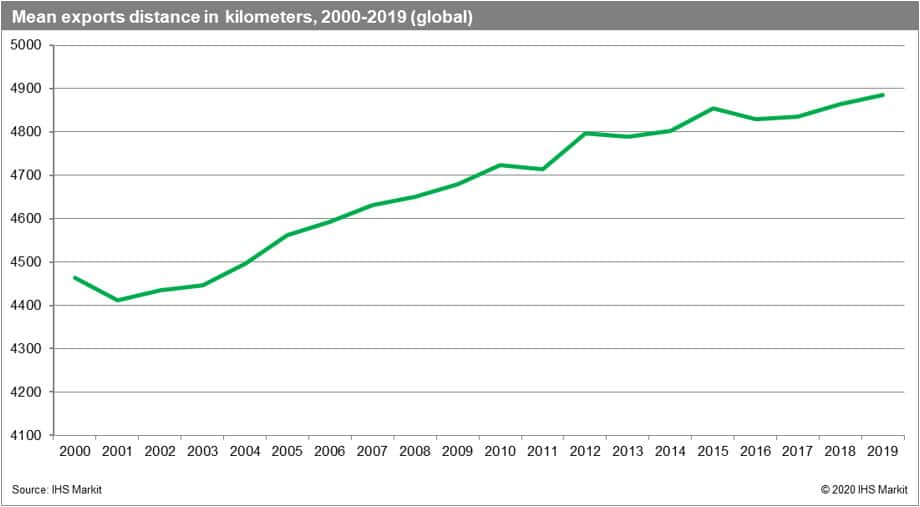
- Mean export distance increased by 9.5% over the period 2000-19, from 4,464 kilometers in 2000 to 4,886 kilometers in 2019
- Mean export distance globally shows an upward trend within the analyzed period with a visibly negative impact of global crises
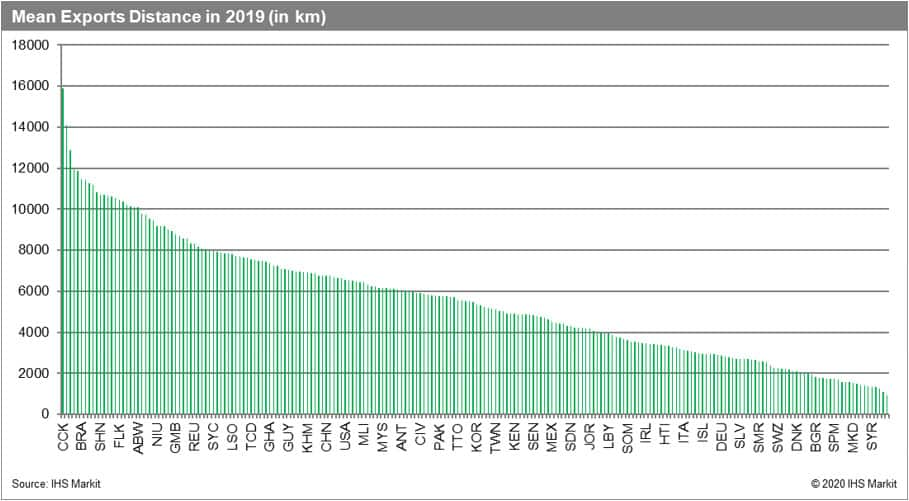
- Mean export distance varies significantly between countries; from 984 kilometers for Bosnia & Herzegovina to 15,867kilometers for Cocos Islands
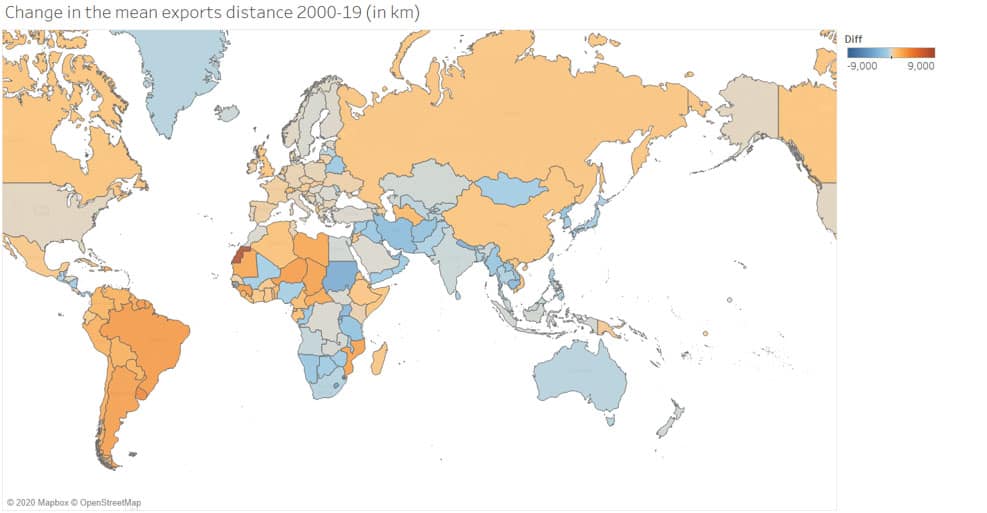
- In Asia, over the period 2000-19 mean export distance increased significantly in Vietnam (by 975 km) and in China mainland (by 851 km) while it decreased in most of the countries of South, Southeast and East Asia which could be indicative of the emergence of regional value-added chain with a hub in China mainland
- In Europe the changes were not drastic (apart from Belarus); in North America increases in the mean export distance were delicate for the US and much more significant for both Mexico and Canada
- Overall, the largest increases in the mean export distance were observed in South American economies, especially for Brazil, Argentina, and Chile with the largest mean distance
Mean export distance
In the gravity approach, trade intensity is proportional to the size of trade partners and inversely proportional to the distance. Trade gravity is one of the most robust and established relationships in economics in general.
In the present analysis, we have combined the GTA Forecasting historical trade data over the period 2000-19 with the matrix of bilateral distances between countries using the "as the crow flies" approach between their capital cities and weighted distance using the distance between the three largest cities by the population of the reporter and partner.
Knowing the intensity of trade and the structure of trade relations by country, we have calculated the mean export distance (in kilometers) for individual reporters in our database as an export-weighted mean, analyzed the patterns and their evolution over time.
Mean export distance is a function of:
- The location of an economy (its absolute centrality/peripherality)
- The location of a given economy and its position in the hierarchy of global value chains
- The overall extent of openness of a given economy - participation in globalization
- Formation of regional trade agreements
From a business perspective, the distance of trade together with the nature of the exported product has an impact on the choice of means of transport.
The variation in mean export distance and its changes
Mean export distance increased by 9.5% over the period 2000-19 from 4,464 kilometers in 2000 to 4,886 kilometers in 2019. An average mean export distance globally shows an upward trend within the analyzed period with a visibly negative impact of global crises.
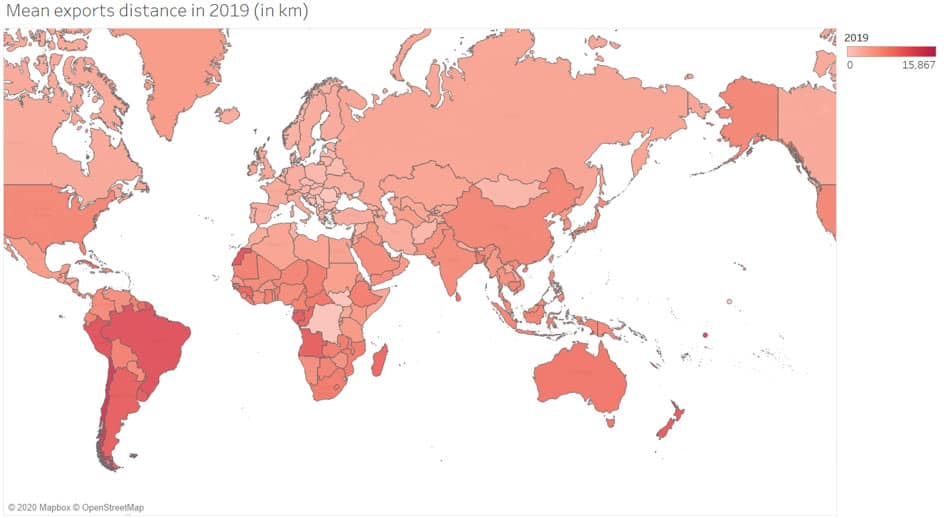
Overall mean export distance differs significantly between countries. It varies from 984 km for Bosnia & Herzegovina, 1,086 km for Belarus, 1,272 for Slovenia, 1,340 km for Croatia up to 15,867 km for Cocos Islands, 14,095 for Chile, and 12,871 for Tokelau. In general, the distance is the lowest for small economies in Europe and the largest for peripherally located Pacific Ocean (in particular island states in Polynesia and Micronesia) and South America states. Thus, to a substantial extent, reflects the distribution of landmass between the northern and southern hemisphere and the size of states.
The mean export distance globally has been significantly affected by one key factor - the unprecedented growth of China (mainland) and thus the shift of locus in global economic activity in particular in the manufacturing towards East and Southeast Asia, in general, observed over the last four decades.
The change in the mean export distance in the analyzed period 2000-19 brings interesting results from a regional perspective.
In Asia mean export distance increased significantly in Vietnam (by 975 km) and in China mainland (by 851 km). The mean export distance decreased, however, in all surrounding states. South American economies significantly increased their mean export distance and thus participation in globalization. The mean export distance decreased significantly in most of Sub-Saharan Africa, across Western and South Asia and Australia. The partial transformation in Russia opened the country to more global trade. In Europe and the US, in turn, the mean export distance has not changed significantly. It increased to a larger extent in Mexico and Canada, both part of USMCA (successor to NAFTA). The largest increase in mean export distance over the observed period applies to Western Sahara in the Maghreb region of Northern Africa.
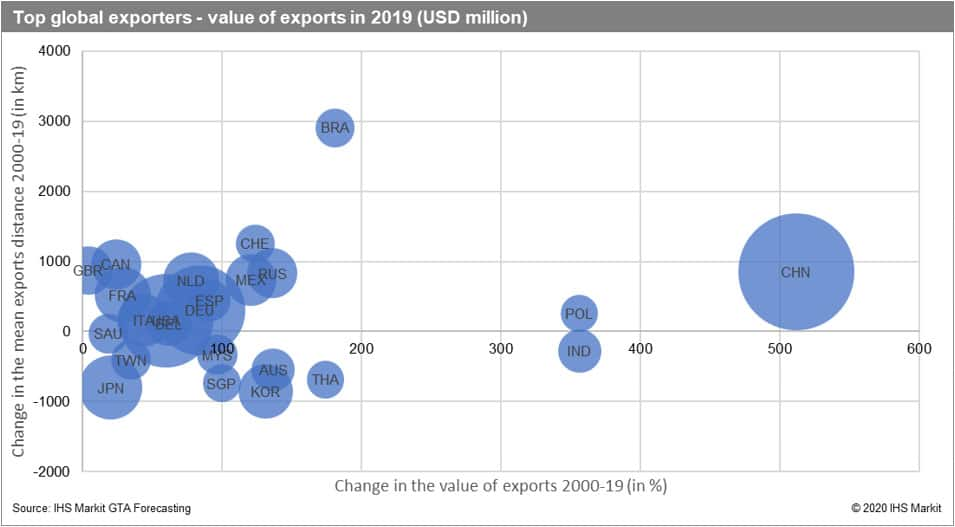
Taking into account the size of exports in 2019 and focusing on the top 30 economies of the world we can plot the following graph showing the change in mean export distance over the analyzed period 2000-19 (in kilometers) as well as the growth of exports (in %) over the analyzed period.
In terms of the dynamic of growth in exports, three countries stand out: China, India, and Poland. In terms of the increase in the mean export distance, it's Brazil. Once again, we see that the Chinese and Vietnamese mean export distance increased while it decreased in most large economies of the region of Eastern, Southeastern, and South Asia as well as Australia. It could be indicative of the development of the regional value chain with China mainland as a hub.
This column is based on data from IHS Markit GTA Forecasting
Subscribe to our monthly newsletter and stay up-to-date with our latest analytics
{"items" : [
{"name":"share","enabled":true,"desc":"<strong>Share</strong>","mobdesc":"Share","options":[ {"name":"facebook","url":"https://www.facebook.com/sharer.php?u=http%3a%2f%2fprod.azure.ihsmarkit.com%2fmarketintelligence%2fen%2fmi%2fresearch-analysis%2finsight-into-the-global-variation-of-mean-export-distance.html","enabled":true},{"name":"twitter","url":"https://twitter.com/intent/tweet?url=http%3a%2f%2fprod.azure.ihsmarkit.com%2fmarketintelligence%2fen%2fmi%2fresearch-analysis%2finsight-into-the-global-variation-of-mean-export-distance.html&text=Insight+into+the+global+variation+of+mean+export+distance++%7c+S%26P+Global+","enabled":true},{"name":"linkedin","url":"https://www.linkedin.com/sharing/share-offsite/?url=http%3a%2f%2fprod.azure.ihsmarkit.com%2fmarketintelligence%2fen%2fmi%2fresearch-analysis%2finsight-into-the-global-variation-of-mean-export-distance.html","enabled":true},{"name":"email","url":"?subject=Insight into the global variation of mean export distance | S&P Global &body=http%3a%2f%2fprod.azure.ihsmarkit.com%2fmarketintelligence%2fen%2fmi%2fresearch-analysis%2finsight-into-the-global-variation-of-mean-export-distance.html","enabled":true},{"name":"whatsapp","url":"https://api.whatsapp.com/send?text=Insight+into+the+global+variation+of+mean+export+distance++%7c+S%26P+Global+ http%3a%2f%2fprod.azure.ihsmarkit.com%2fmarketintelligence%2fen%2fmi%2fresearch-analysis%2finsight-into-the-global-variation-of-mean-export-distance.html","enabled":true}]}, {"name":"rtt","enabled":true,"mobdesc":"Top"}
]}