Customer Logins
Obtain the data you need to make the most informed decisions by accessing our extensive portfolio of information, analytics, and expertise. Sign in to the product or service center of your choice.
Customer Logins
BLOG
Jul 24, 2020
GTA Research Paper: Case Study of Commodity Trading for Financials

A research addressing the use case and role of statistical trade data in commodity trading.
Key points:
- Traditional 'commodity' labels show a direct linkage with Harmonised System codes (HS Codes)
- Spot prices have high correlations to data concepts found within statistical trade data
- The structured extended history and multiple concepts found within the Global Trade Atlas (GTA) data could be used in modelling and forecasting
Case Study of Commodity Trading for Financials
We at IHS Markit are constantly working towards developing new insights and applications for our assets and solution.
Lately, we have been working towards better understanding the relationship between bilateral trade data and financial markets data as to establish if there are any statistical relationships between the two datasets that might in turn prove insightful when looking at commodity markets.
The research paper was devised to provide a fundamental base, not only describing the bilateral trade data, but also trying to answer the below questions:
- Can Harmonised System codes (HS codes) be mapped against more traditional 'commodity' labels?
- Can any of the concepts found in statistical trade data be correlated to spot prices?
- Could the data be used within the scope of predictive analytics to predict fluctuations in tradable commodity prices?
Commodity Mapping
Trade data as reported by National Statistical Authorities is structured and organised under the Harmonised System (otherwise referred to as HS Codes); this is a multi-layered coding system introduced in 1988 and is now adopted by more than 200 countries. These codes which are internationally standardised at the 6 digits covering more than 5,000 different physical goods.
These HS Codes are made up of:
- Chapters, of which there are 99. These make up the first two digits and are broad 'buckets' of homogeneous commodities (e.g. HS12: Oils, Seeds & Oleaginous Fruits)
- Headings, of which there are more than 1,000. These make up the second set of two digits which distinguishes certain sub-types of goods (e.g. HS12.01: Soybeans, Whether Or Not Broken)
- Sub-headings, of which there are more than 5000. These make up the third set of two digits which further distinguish sub-types under the header (e.g. HS12.01.90: Soybeans, Other Than Seed)
This in all gives you a 6-digit code highlighting its classification (e.g. HS 12.01 90). There are further sub-classifications beyond that of 6 digits known as National Codes or Tariff Lines used which are country specific in nature and primarily used for customs purposes.
This type of coding is not necessarily easy to map against more traditional commodity data used in the financial world, but our market expertise and understanding of the data allows us to work alongside our clients in interpreting and mapping the data to commodities and industries. An example of this can be seen in Figure 1 where we can identify key commodities and map them to a single label.
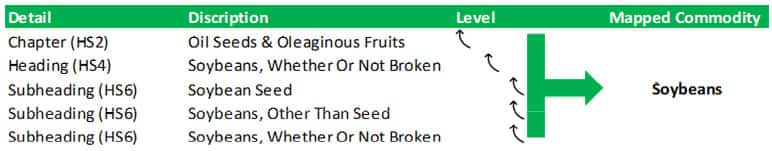
Figure 1: Example of commodity mapping being applied to HS codes. Source: IHS Markit Global Trade Atlas
Concepts of Interest
The GTA has many different reporting concepts, ranging from primary/secondary quantity, value, unit price by direction (import, export, total trade), and trade partner. In the paper, we found that unit prices were highly correlated to spot prices, with higher correlations being found on the import/export directions depending on the primary activity of that country (the US for example is a huge exporter of soybeans therefore exports had higher statistical significance).
One of the benefits of this type of data is that whereas spot prices are very one dimensional unless combined with other datasets, unit price concepts found in the Global Trade Atlas database are multi-dimensional, and can be broken down by quantity, value and trade partner - this in turn can allow for a better understanding of how markets are affected by changes in quantity, value by trade partner.
In Figure 2, we see how soybeans have been mapped as to demonstrate the relationship between GTA's US exports of soybean to that of the US soybean spot price. This yielded a 0.9R2.
US soybean, GTA export unit price (US$/T) vs soybean spot price (US$/Bushel)
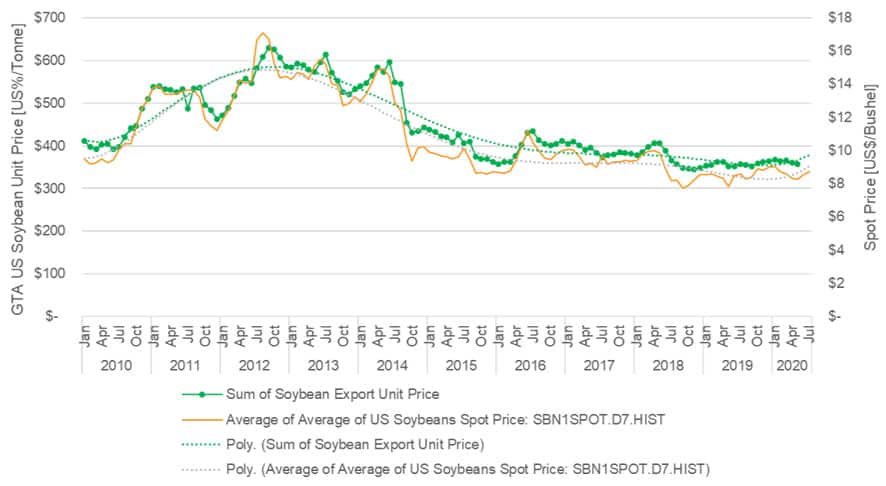
Figure 2: Mapped GTA data against US spot prices. IHS Markit Global Trade Atlas and Financial Markets - Historical
Potential Use Case
With such a relationship being established, we can look at additional dimensions, such as month-on-month growth rates for the two data sets to see if there is any lead-lag which might be insightful when looking at building particular data models (Figure 3). Or perhaps explore how changes in volume and value by trade partner affects the unit price, which might in turn provide insights into how the spot market might react.
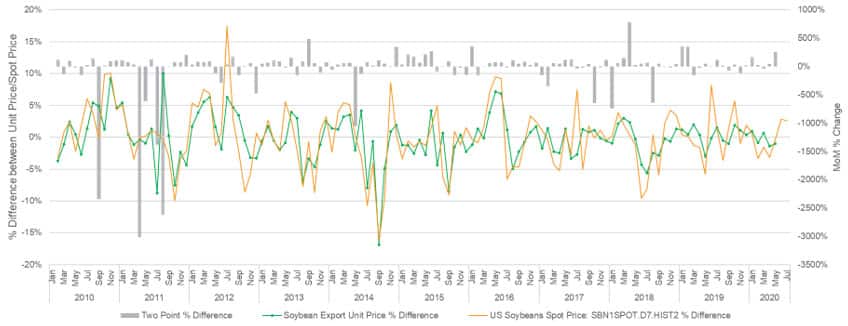
Figure 3: Month-on-month percent change of GTA unit price vs US spot prices. Source: IHS Markit Global Trade Atlas and Financial Markets
Due to the structured extended history (extends to more than 20 years in some instances) The mapped data can then go on to be used in predictive modelling to as to gain actionable insights into how the market might evolve going forward. Or even perhaps look at additional financial concepts such as futures to see if any significant statistical relationships exist.
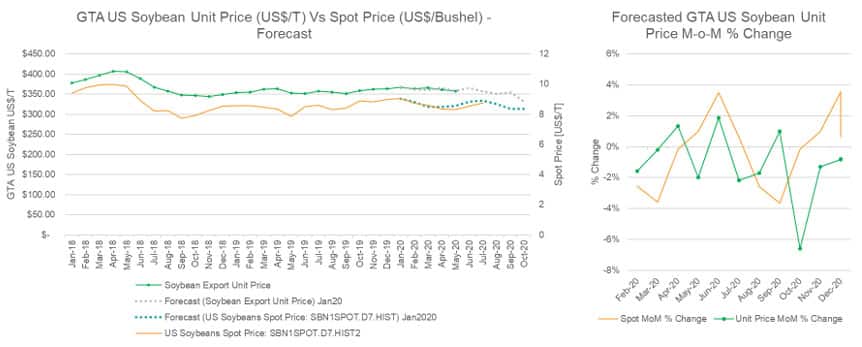
Figure 4: ETS forecast of mapped GTA data against US spot prices. Source: IHS Markit Global Trade Atlas and Financial Markets - Historical
About GTA
Find out more about our Global Trade Atlas data and the research paper, or visit our Global Trade Atlas solutions page for more information.
- Global Trade Atlas is the world's most comprehensive database of official bilateral trade data covering imports and exports by quantity, value and unit price for over 96% of world trade. Providing insight into all reported 'physical' commodities under the Harmonised System, across all transportation modes for 101 countries
- With over 20 years' worth of data available and covering about 5,000 commodities, the Global Trade Atlas is used by governments, like the EU and US to assess trade, as well as corporations that need an official source to quantify markets, monitor trends and identify opportunities in emerging markets. This type of data is also consumed by financial institutions whom need to fully understand the macroeconomic landscape of a country and conduct market evaluations
{"items" : [
{"name":"share","enabled":true,"desc":"<strong>Share</strong>","mobdesc":"Share","options":[ {"name":"facebook","url":"https://www.facebook.com/sharer.php?u=http%3a%2f%2fprod.azure.ihsmarkit.com%2fmarketintelligence%2fen%2fmi%2fresearch-analysis%2fgta-paper-case-study-of-commodity-trading-for-financials.html","enabled":true},{"name":"twitter","url":"https://twitter.com/intent/tweet?url=http%3a%2f%2fprod.azure.ihsmarkit.com%2fmarketintelligence%2fen%2fmi%2fresearch-analysis%2fgta-paper-case-study-of-commodity-trading-for-financials.html&text=GTA+Research+Paper%3a+Case+Study+of+Commodity+Trading+for+Financials+%7c+S%26P+Global+","enabled":true},{"name":"linkedin","url":"https://www.linkedin.com/sharing/share-offsite/?url=http%3a%2f%2fprod.azure.ihsmarkit.com%2fmarketintelligence%2fen%2fmi%2fresearch-analysis%2fgta-paper-case-study-of-commodity-trading-for-financials.html","enabled":true},{"name":"email","url":"?subject=GTA Research Paper: Case Study of Commodity Trading for Financials | S&P Global &body=http%3a%2f%2fprod.azure.ihsmarkit.com%2fmarketintelligence%2fen%2fmi%2fresearch-analysis%2fgta-paper-case-study-of-commodity-trading-for-financials.html","enabled":true},{"name":"whatsapp","url":"https://api.whatsapp.com/send?text=GTA+Research+Paper%3a+Case+Study+of+Commodity+Trading+for+Financials+%7c+S%26P+Global+ http%3a%2f%2fprod.azure.ihsmarkit.com%2fmarketintelligence%2fen%2fmi%2fresearch-analysis%2fgta-paper-case-study-of-commodity-trading-for-financials.html","enabled":true}]}, {"name":"rtt","enabled":true,"mobdesc":"Top"}
]}