Customer Logins
Obtain the data you need to make the most informed decisions by accessing our extensive portfolio of information, analytics, and expertise. Sign in to the product or service center of your choice.
Customer Logins
ECONOMICS COMMENTARY
Sep 01, 2020
Global factories report fastest output growth for nearly two-and-a-half years

- Global manufacturing PMI at highest since November 2018 as production upturn gathers momentum
- Upturn led by Brazil, UK and Germany
- China records best year-to-date performance
- Global trade shows signs of stabilising for first time in two years, job losses ease
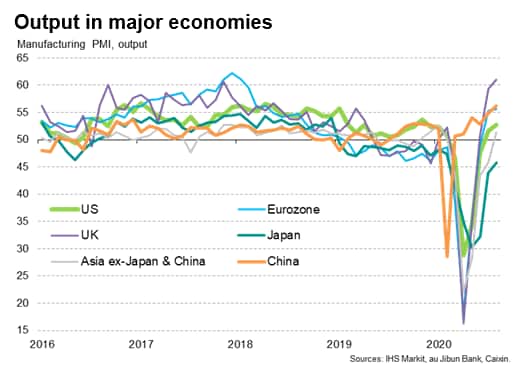
Global manufacturing output rose at the fastest rate for over two years in August as the world's factories continued to recover from COVID-19 related lockdowns. The rebound was led by Brazil, the UK, Germany, Italy and China. However, especially weak performances continued to be seen in many parts of Asia, linked in part to the slow recovery of global trade, albeit with worldwide exports now showing signs of stabilising.
Job losses meanwhile eased as firms increasingly sought to boost capacity to meet expectations of rising demand, though the ongoing cull to jobs hints at cautiousness with regard to spending and hiring.
Output index at highest since 2018
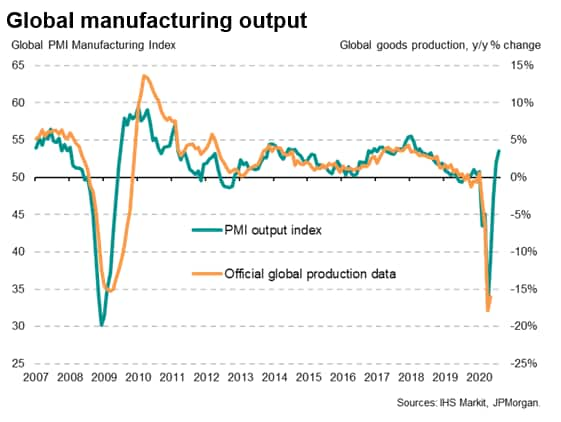
The JPMorgan Global Manufacturing PMI, compiled by IHS Markit from its proprietary business surveys, rose from 50.6 in July to 51.8, its highest since November 2018, buoyed by production growth accelerating to the fastest since April 2018.
Since 2007, when IHS Markit's US PMI data were first included in the index, the global PMI's output gauge has exhibited an 84% correlation with the annual rate of change of official production data, underscoring how the PMI provides a very accurate guide to changing output trends. Importantly, the PMI is available several months ahead of the comparable official data.
An OLS regression can be used to determine what a PMI reading implies in terms of annual growth1. The implied annual growth rate can be estimated as follows:
Global manufacturing output annual % change =
PMI output index x 0.0101 - 0.506
At July's level, the survey's output index is consistent with an annual rate of growth of 3.6%, which contrasts markedly with the peak 17.7% rate of decline indicated back in April. To clarify, the index is not indicating that output is 3.6% higher than a year ago, but merely that production is now growing at a rate comparable to 3.6% per annum, representing a further gaining of momentum in the sector's recovery of the output lost during the pandemic.
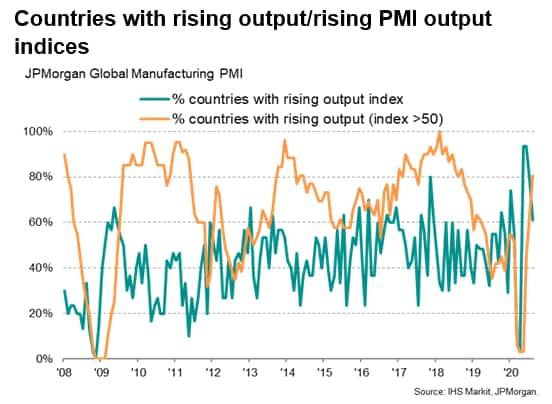
Further encouragement came from a rise in the number of countries reporting output growth in August. Of the 31 markets covered by IHS Markit's manufacturing PMI surveys, some 25 reported higher output in August. At 81%, this was the highest proportion since September 2018 and up from 65% in July and just 3% (i.e. just China) in April and May.
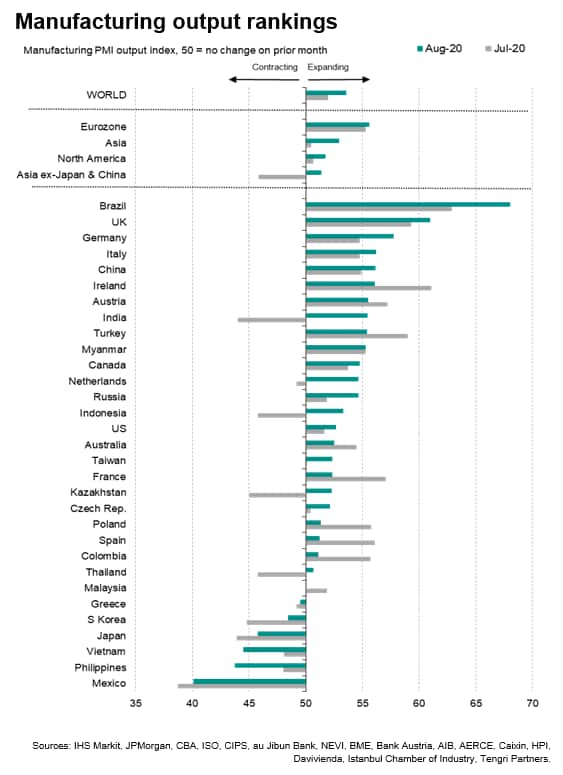
Brazil reported the fastest rate of expansion for a second month running, followed by the UK and then Germany, Italy and China. More modest, but nonetheless accelerating, growth was recorded in the US and Canada.
The steepest decline was meanwhile recorded in Mexico. Besides Mexico and Greece, all other contracting manufacturing economies were located in Asia, including Japan.
Asia excluding Japan and China also notably continued to markedly underperform relative to Europe and North America, despite the region returning to growth for the first time since February.
Less encouraging was a dip in the number of countries with rising output indices. Indices fell - indicating either slower rates of expansion or increased rates of decline - in 11 of the 31 markets. Back in April and May, all but two markets had reported rising output indices. Both Vietnam and the Philippines reported increased rates of contraction while growth slowed especially sharply in Ireland, Spain and France.
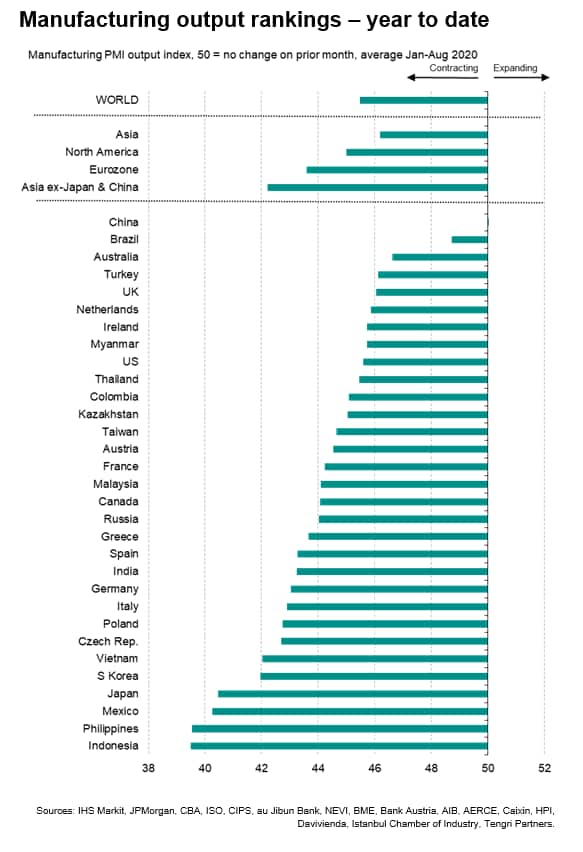
China leads year-to-date output rankings
Looking at manufacturing production in the year to date, China has seen the smallest impact from COVID-19, with the PMI output index registering 50, indicating unchanged production on average in the first eight months of the year. All other economies have seen falling output on average.
Relatively shallow (below global average) downturns over the course of the first eight months of the year have meanwhile also been reported in Brazil, Australia, Turkey, the UK, the Netherlands, Ireland, Myanmar and the US.
While the outperformance of China has helped Asia as a whole see a smaller downturn than Europe or North America in the year to date, if China is excluded the region has underperformed quite markedly so far this year.
The worst performance in the year to date has been recorded in Indonesia, followed by the Philippines and then Mexico and Japan.
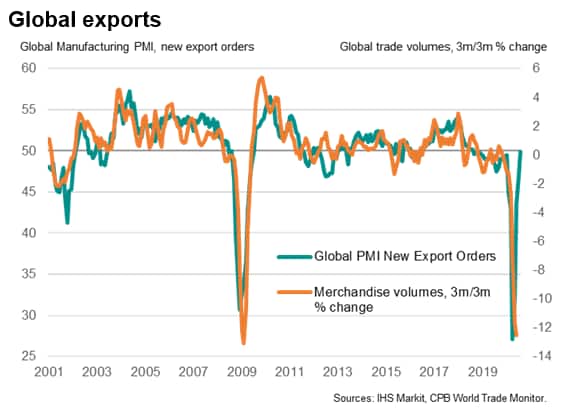
Global trade shows signs of stabilising
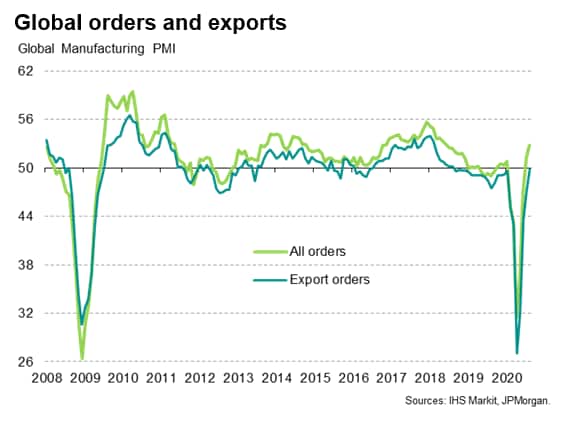
Part of the reason for some countries' below-par performances can be blamed on their greater exposure to international trade and associated reliance on export demand. Although global new orders rose for a second month running in August, increasing at the fastest rate since June 2018, global exports continued to lag behind overall demand, albeit stabilising. Global exports have not risen since September 2018.
Weak trade was again linked to demand and supply having been disrupted by the pandemic. However, the subdued pattern of trade also reflected the lingering impact of trade wars.
The steadying of global exports nonetheless comes as a welcome development. The latest aggregated national data on exports from the CPB showed global levels down some 17% in May compared to the end of last year.
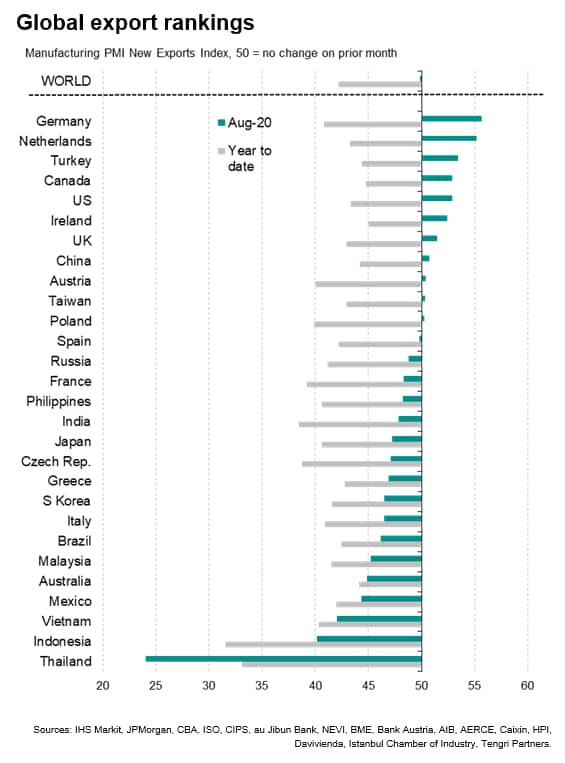
The strongest export growth was commonly seen in eurozone members states, led by Germany and the Netherlands, possibly reflecting the relative ease of trading between members of the bloc (intra eurozone trade is included in exports). The steepest declines were seen in Thailand, Indonesia and Vietnam.
Job losses ease as optimism improves
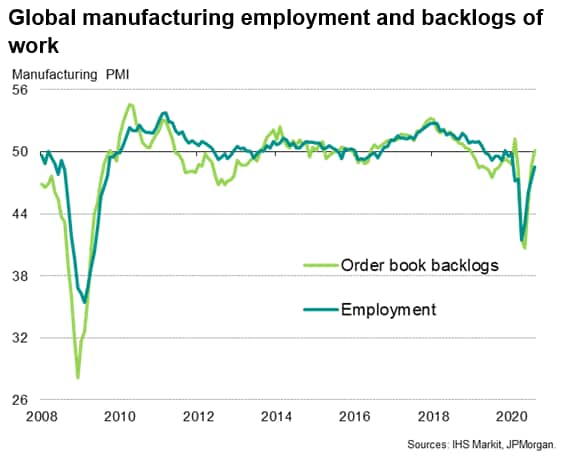
The improved order book situation led to an easing in global job losses. Factory employment fell globally for a ninth successive months, but the rate of decline moderated to the lowest since January. Order book backlogs meanwhile rose fractionally, up for the first time since February, hinting at likely further improvement in the job market in September.
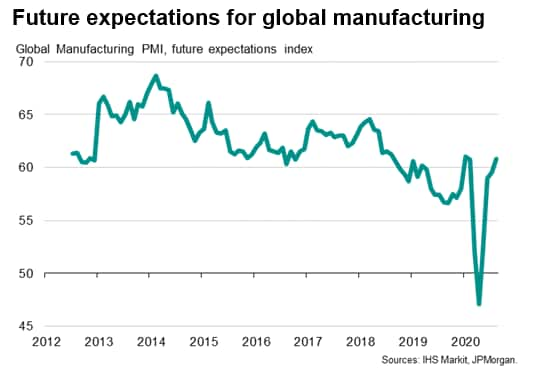
The August survey also saw manufacturers become more upbeat about future prospects, with expectations of output over the coming year rising to the highest since February.
Using the PMI
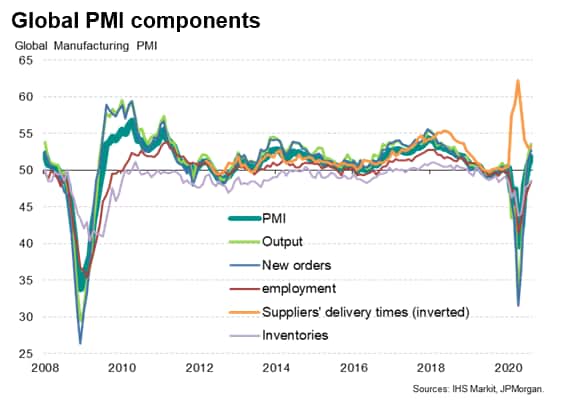
Note that we continue to focus our analysis on the PMI survey output indices rather than the headline 'PMI'. The headline PMI figure is a composite gauge derived from five survey variables: output, new orders, employment, inventories and suppliers' delivery times. These five components usually move in a synchronised pattern. However, due to supply chain delays arising from the COVID-19 pandemic, the suppliers' delivery times index has moved counter-cyclically, dampening the signal from the PMI.
1The regression yields an adjusted r-square of 0.70 with a standard error of 0.028. The r-square rises to 0.76 if lagged values of the PMI are also used to reflect the PMI's lead over official data.
Chris Williamson, Chief Business Economist, IHS
Markit
Tel: +44 207 260 2329
chris.williamson@ihsmarkit.com
© 2020, IHS Markit Inc. All rights reserved. Reproduction in whole or in part without permission is prohibited.
Purchasing Managers' Index™ (PMI™) data are compiled by IHS Markit for more than 40 economies worldwide. The monthly data are derived from surveys of senior executives at private sector companies, and are available only via subscription. The PMI dataset features a headline number, which indicates the overall health of an economy, and sub-indices, which provide insights into other key economic drivers such as GDP, inflation, exports, capacity utilization, employment and inventories. The PMI data are used by financial and corporate professionals to better understand where economies and markets are headed, and to uncover opportunities.
This article was published by S&P Global Market Intelligence and not by S&P Global Ratings, which is a separately managed division of S&P Global.
{"items" : [
{"name":"share","enabled":true,"desc":"<strong>Share</strong>","mobdesc":"Share","options":[ {"name":"facebook","url":"https://www.facebook.com/sharer.php?u=http%3a%2f%2fprod.azure.ihsmarkit.com%2fmarketintelligence%2fen%2fmi%2fresearch-analysis%2fglobal-factories-report-fastest-output-growth-for-nearly-two-and-a-half-years-sep20.html","enabled":true},{"name":"twitter","url":"https://twitter.com/intent/tweet?url=http%3a%2f%2fprod.azure.ihsmarkit.com%2fmarketintelligence%2fen%2fmi%2fresearch-analysis%2fglobal-factories-report-fastest-output-growth-for-nearly-two-and-a-half-years-sep20.html&text=Global+factories+report+fastest+output+growth+for+nearly+two-and-a-half+years+%7c+S%26P+Global+","enabled":true},{"name":"linkedin","url":"https://www.linkedin.com/sharing/share-offsite/?url=http%3a%2f%2fprod.azure.ihsmarkit.com%2fmarketintelligence%2fen%2fmi%2fresearch-analysis%2fglobal-factories-report-fastest-output-growth-for-nearly-two-and-a-half-years-sep20.html","enabled":true},{"name":"email","url":"?subject=Global factories report fastest output growth for nearly two-and-a-half years | S&P Global &body=http%3a%2f%2fprod.azure.ihsmarkit.com%2fmarketintelligence%2fen%2fmi%2fresearch-analysis%2fglobal-factories-report-fastest-output-growth-for-nearly-two-and-a-half-years-sep20.html","enabled":true},{"name":"whatsapp","url":"https://api.whatsapp.com/send?text=Global+factories+report+fastest+output+growth+for+nearly+two-and-a-half+years+%7c+S%26P+Global+ http%3a%2f%2fprod.azure.ihsmarkit.com%2fmarketintelligence%2fen%2fmi%2fresearch-analysis%2fglobal-factories-report-fastest-output-growth-for-nearly-two-and-a-half-years-sep20.html","enabled":true}]}, {"name":"rtt","enabled":true,"mobdesc":"Top"}
]}