Customer Logins
Obtain the data you need to make the most informed decisions by accessing our extensive portfolio of information, analytics, and expertise. Sign in to the product or service center of your choice.
Customer Logins
BLOG
Jul 02, 2020
Charting COVID-19 Pandemic Effects on International Trade

US-Mexico Cross-Border Trade via Mexico Customs BOL Data
Mexico Customs bill of lading (BOL) data allows us to track US-Mexico cross-border trade using all transport methods such as truck, rail, maritime, pipeline and air. Usually available earlier than official trade statistics, it also tracks the shipper and consignee companies at either end of the shipment, and shipment-specific values and quantities. Monthly publications expected approximately the 24th of each month for the previous month.
Source: IHS Markit PIERS
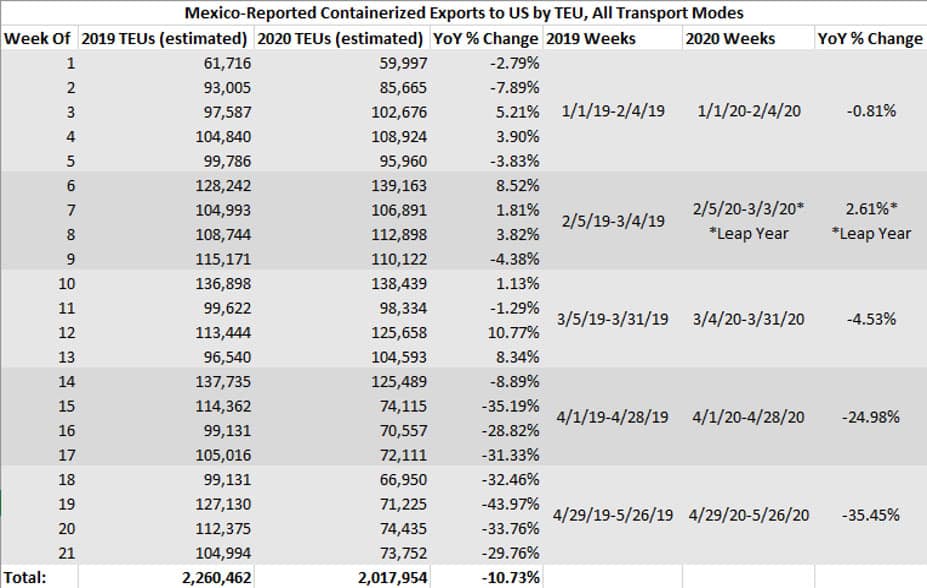
Mexico didn't impose large-scale quarantines until the last week of March, and the containerized export volume declines (measured in 20-foot equivalent units (TEUs)) in the four-week periods representing most of April and May 2020 certainly reflect a significant downturn in export-related activity. April 2020 TEU exports nosedived nearly 25% and May plunged over 35% compared to the aggregated weekly volumes for the same four-week time periods a year earlier. The decrease peaked at a nearly 44% decline year-on-year for Week 19 2020 (May 6-May 12, 2020).
This trend represents a notable downturn compared to the first three months. After all, total Mexico TEU exports to the US were relatively flat the first 13 weeks of 2020, declining just 0.9% compared to the same period in 2019, closely tracking 2019 and 2018.
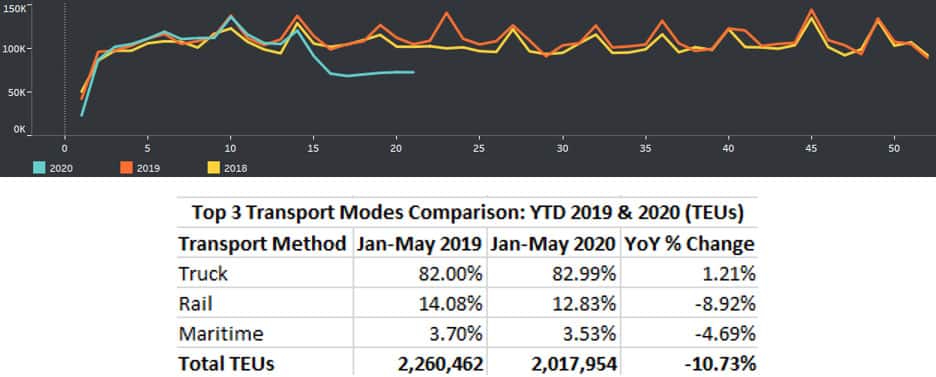
Mexico-Reported Containerized Exports to US by TEU, All Transport Modes, 2018-May 2020
Source: IHS Markit PIERS
Most cross-border containerized goods are moved by truck (~83%), followed by rail (~13%) then maritime (~4%), with little change year-on-year even throughout the pandemic disruption.
Looking ahead to the June 2020 Containerized Baseline
June 2020 data is not expected to be released until approximately July 24, 2020. The June 2019 baseline TEU volumes for comparison purposes were approximately 575,022, a 30% month-on-month increase over May 2019 volumes.
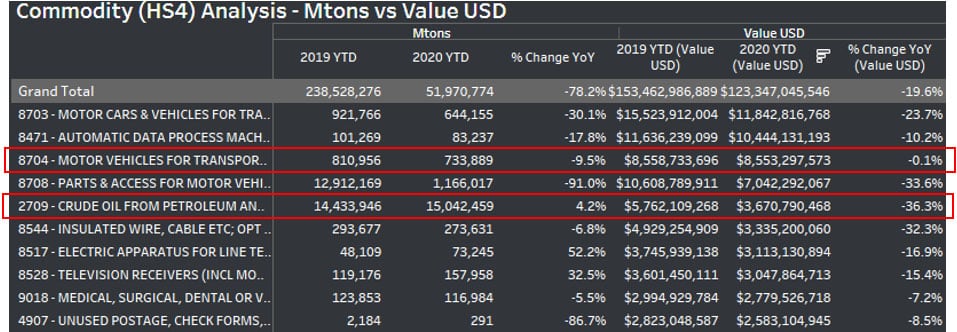
Analyzing the same period using metric tons (MTONS), which contains both containerized cargoes and non, the situation is bleaker still. The first 21 weeks of the year showed a 78.2% decrease in total metric tons, with overall value declining 19.6%.
Source: IHS Markit PIERS
By USD value, the top 5 traded commodities are in the areas of automotive, digital processing machines and crude oil. Commercial vehicles for the transport of goods (HS 8704) remained flat on a year-on-year basis, despite earlier maintaining a growth rate at a 50% year-on-year basis for the first 13 weeks of the year. By MTONs, the category has declined 9.5%.
Crude oil (HS 2709) export volumes increased 4.2% MTONs year-on-year, but the crash in crude oil prices globally resulted in a decline of 36.3% by value.
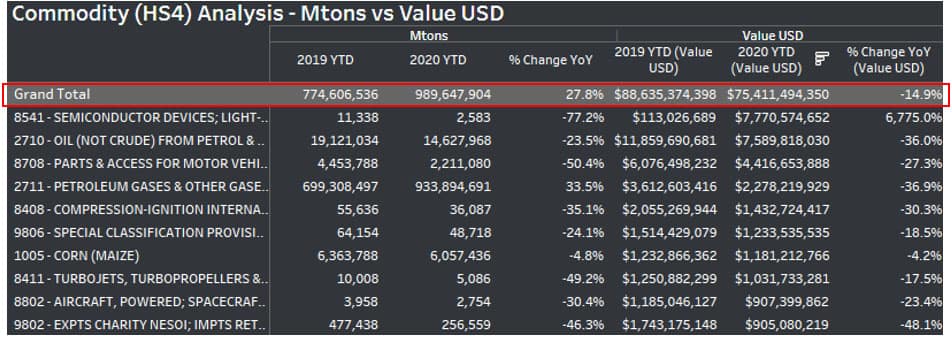
Mexico usually carries a trade surplus with the US, exporting more than it imports from its northern neighbour. For the first 21 weeks of the year, Mexico increased import MTONs from the US by 27.8% year-on-year but decreased import value by 14.9% USD overall, with wild swings depending on the specific commodity category.
Source: IHS Markit PIERS
Subscribe to our monthly newsletter and stay up-to-date with our latest analytics
{"items" : [
{"name":"share","enabled":true,"desc":"<strong>Share</strong>","mobdesc":"Share","options":[ {"name":"facebook","url":"https://www.facebook.com/sharer.php?u=http%3a%2f%2fprod.azure.ihsmarkit.com%2fmarketintelligence%2fen%2fmi%2fresearch-analysis%2fcharting-covid19-pandemic-effects-on-international-trade.html","enabled":true},{"name":"twitter","url":"https://twitter.com/intent/tweet?url=http%3a%2f%2fprod.azure.ihsmarkit.com%2fmarketintelligence%2fen%2fmi%2fresearch-analysis%2fcharting-covid19-pandemic-effects-on-international-trade.html&text=Charting+COVID-19+Pandemic+Effects+on+International+Trade+%7c+S%26P+Global+","enabled":true},{"name":"linkedin","url":"https://www.linkedin.com/sharing/share-offsite/?url=http%3a%2f%2fprod.azure.ihsmarkit.com%2fmarketintelligence%2fen%2fmi%2fresearch-analysis%2fcharting-covid19-pandemic-effects-on-international-trade.html","enabled":true},{"name":"email","url":"?subject=Charting COVID-19 Pandemic Effects on International Trade | S&P Global &body=http%3a%2f%2fprod.azure.ihsmarkit.com%2fmarketintelligence%2fen%2fmi%2fresearch-analysis%2fcharting-covid19-pandemic-effects-on-international-trade.html","enabled":true},{"name":"whatsapp","url":"https://api.whatsapp.com/send?text=Charting+COVID-19+Pandemic+Effects+on+International+Trade+%7c+S%26P+Global+ http%3a%2f%2fprod.azure.ihsmarkit.com%2fmarketintelligence%2fen%2fmi%2fresearch-analysis%2fcharting-covid19-pandemic-effects-on-international-trade.html","enabled":true}]}, {"name":"rtt","enabled":true,"mobdesc":"Top"}
]}