Customer Logins
Obtain the data you need to make the most informed decisions by accessing our extensive portfolio of information, analytics, and expertise. Sign in to the product or service center of your choice.
Customer Logins
BLOG
Aug 23, 2018
“All-aboard!”: Inflation station
- Inflation Sensitivity key factor for US equity returns in August
- Best monthly performance for Inflation factor since October 2016
- Highly shorted stocks with positive Inflation Sensitivity outperform
On August 10th the BLS reported a 0.2% increase in consumer prices for July, putting the YoY CPI increase at 2.9%. That announcement sent the message to investors that the trend of rising prices remains in-tact, suggesting that the Federal Reserve's course of hiking interest rates is also likely to continue. Unsurprisingly, US equities with a positive correlation to inflation have performed well in August. IHS Markit's Research Signals quantitative research product produces an Inflation Sensitivity factor as a component of their Macroeconomic model. The Inflation Sensitivity factor tracks the performance of a given equity relative to historical changes in CPI.
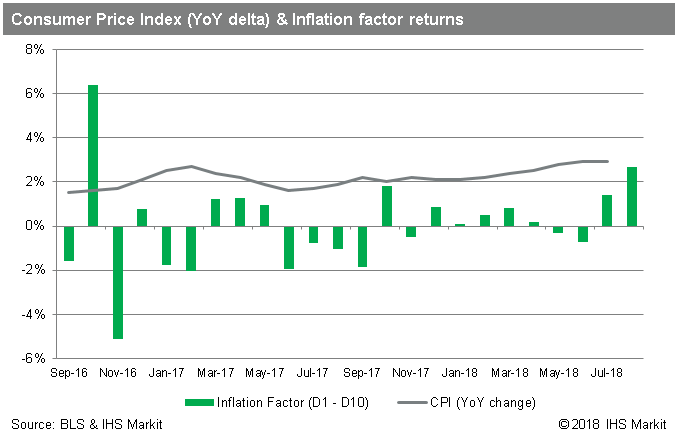
Through the first three weeks of August, US equities with most positive correlation to increasing inflation returned 4.2%, while the stocks with the lowest correlation returned 1.9%. The last time inflation sensitivity had such a strong correlation to share prices was in October 2016, when YoY CPI change hit a multi-year high, having fallen with energy prices earlier in that year. In that month the stocks with a positive correlation to inflation returned -3.2%, while those with the most negative sensitivity to rising prices returned -10.2%. Through the third week of August, 2018 is on pace to be the first year of positive returns for the inflation factor since 2011, when YoY CPI increase hit the highest level post-crisis, 3.9% in September, before tumbling through July 2012.
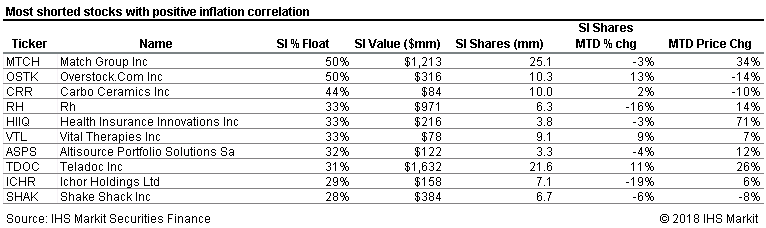
While the group of US equities with positive correlation to rising prices has outperformed the broader US equity market, a subset of that group has shown further outperformance: The most shorted stocks. The average price return of the most shorted stocks with positive inflation correlation was 4.6% in the first three weeks of August, compared to 3.6% for the rest of the positive correlation group. The most shorted stocks with positive inflation correlation also outperformed the rest of the most shorted stocks, which only returned 2.5%.
Wrap up:
As inflation concerns continue to increase, along with the Fed path of further rate hikes, stocks which have a positive correlation with CPI increases have performed well, as reflected by factor returns to IHS Markit's Inflation Sensitivity factor. Receiving a tailwind from rising prices, the most shorted stocks in that group have performed particularly well in August.
S&P Global provides industry-leading data, software and technology platforms and managed services to tackle some of the most difficult challenges in financial markets. We help our customers better understand complicated markets, reduce risk, operate more efficiently and comply with financial regulation.
This article was published by S&P Global Market Intelligence and not by S&P Global Ratings, which is a separately managed division of S&P Global.
{"items" : [
{"name":"share","enabled":true,"desc":"<strong>Share</strong>","mobdesc":"Share","options":[ {"name":"facebook","url":"https://www.facebook.com/sharer.php?u=http%3a%2f%2fprod.azure.ihsmarkit.com%2fmarketintelligence%2fen%2fmi%2fresearch-analysis%2fall-aboard-inflation-station.html","enabled":true},{"name":"twitter","url":"https://twitter.com/intent/tweet?url=http%3a%2f%2fprod.azure.ihsmarkit.com%2fmarketintelligence%2fen%2fmi%2fresearch-analysis%2fall-aboard-inflation-station.html&text=%e2%80%9cAll-aboard!%e2%80%9d%3a+Inflation+station+%7c+S%26P+Global+","enabled":true},{"name":"linkedin","url":"https://www.linkedin.com/sharing/share-offsite/?url=http%3a%2f%2fprod.azure.ihsmarkit.com%2fmarketintelligence%2fen%2fmi%2fresearch-analysis%2fall-aboard-inflation-station.html","enabled":true},{"name":"email","url":"?subject=“All-aboard!”: Inflation station | S&P Global &body=http%3a%2f%2fprod.azure.ihsmarkit.com%2fmarketintelligence%2fen%2fmi%2fresearch-analysis%2fall-aboard-inflation-station.html","enabled":true},{"name":"whatsapp","url":"https://api.whatsapp.com/send?text=%e2%80%9cAll-aboard!%e2%80%9d%3a+Inflation+station+%7c+S%26P+Global+ http%3a%2f%2fprod.azure.ihsmarkit.com%2fmarketintelligence%2fen%2fmi%2fresearch-analysis%2fall-aboard-inflation-station.html","enabled":true}]}, {"name":"rtt","enabled":true,"mobdesc":"Top"}
]}