Customer Logins
Obtain the data you need to make the most informed decisions by accessing our extensive portfolio of information, analytics, and expertise. Sign in to the product or service center of your choice.
Customer Logins
ECONOMICS COMMENTARY
Apr 16, 2020
US manufacturing suffers record post-war decline in March amid COVID-19 crisis
- Manufacturing output slumps in March, following steep downturn in PMI
- Flash PMI data for April will likely show even steeper downturn as COVID-19 containment measures take further toll
- Data highlight how US is in recession
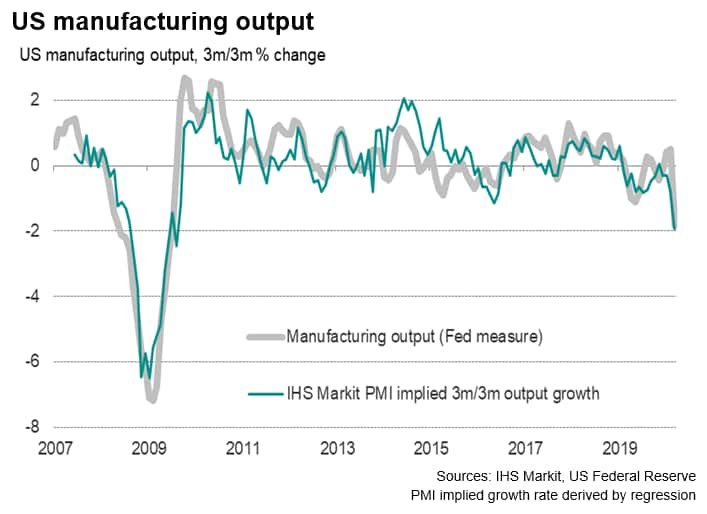
US manufacturing output fell 6.3% in March, the steepest drop since 1946, as measures taken to contain the spread of COVID-19 took their toll on the factory sector.
The latest decline greatly exceeds even the sharpest downturn recorded during the height of the global financial crisis, when the rate of production decline peaked at 3.5%.
The March drop pulled output in the first quarter 1.8% lower than the fourth quarter of last year, which was almost exactly in line with the 1.9% quarterly deterioration signalled in advance by IHS Markit PMI data (see chart). Both PMI and official gauges therefore indicated the steepest quarterly falls in production since 2009, adding to our expectations that the US economy is entering a recession of the likes not seen in recent history.

Estimating output from the PMI survey
In order to get a handle on the actual changes in output signalled by PMI data, we use a basic regression to estimate the implied rate of change signalled by the survey's output index. Note that we do not use the headline PMI to estimate output, as the headline index is a composite measure of survey indices such as suppliers' delivery times, inventories and employment as well as output. The survey's output index therefore acts as a purer guide to official output (production) data as calculated by the Federal Reserve.

The regression uses the PMI output index as the sole explanatory variable of the three-month-on-three month change in official production data. We use this three-month change rate when comparing our surveys with official data as it is less volatile than month-on-month changes but provides more timely signals than the annual rate of change.
The regression analysis from 2007, when PMI data from IHS Markit were first available for the US, yields an adjusted r-square of 0.78 and allows the survey output index to be transformed into a three-month rate of change according to the following formula:

GDP implications
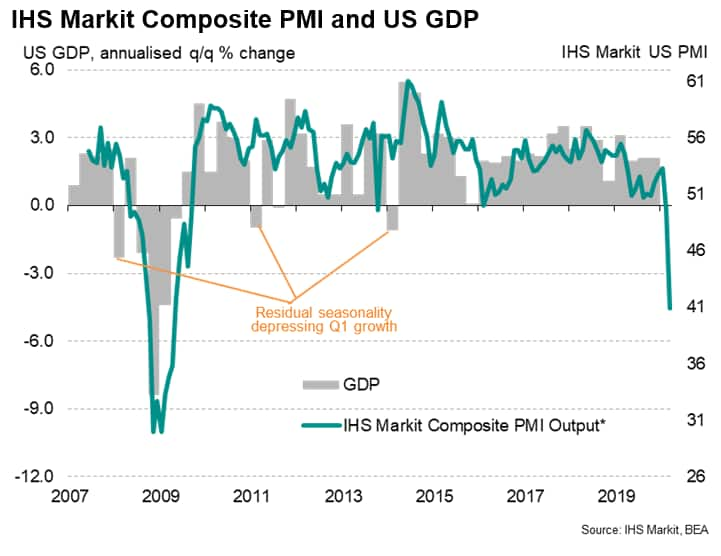
The official manufacturing data were released on the heels of retail sales numbers which showed an 8.7% plunge in expenditure during March as social distancing measures hit consumption. This reduction in consumption had also been flagged in advance by detailed PMI data showing orders for both consumer goods and consumer services to have slumped in March (though goods orders held up somewhat better than services due to rising food production).
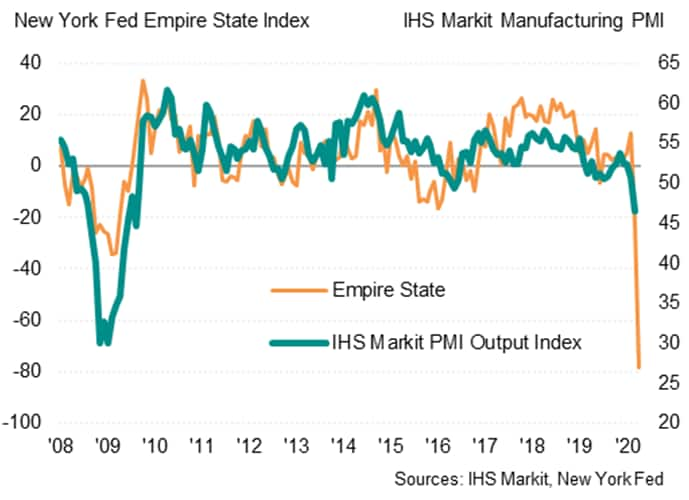
The resulting overall composite PMI for March fell from 49.6 in February to a post-recession low of 40.9. At this level the PMI is indicative of GDP contracting at a quarterly rate approaching 5%, which would counter mild expansions in the first two months of the year to result in a first quarter decline in GDP of around 3%. This is broadly in line with IHS Markit's GDP tracker, which is currently pointing to a second quarter rate of decline in excess of 25% (annualised); clearly, we are expecting the survey and official numbers to get considerably worse as we head into the second quarter. While some regional survey data for April have already been released, such as the Empire State manufacturing survey (see chart), the first national survey data for April will be available via the flash PMIs from IHS Markit, released on 23rd April and covering both manufacturing and services.

Chris Williamson, Chief Business Economist, IHS Markit
Tel: +44 207 260 2329
chris.williamson@ihsmarkit.com
© 2020, IHS Markit Inc. All rights reserved. Reproduction in whole
or in part without permission is prohibited.
Purchasing Managers' Index™ (PMI™) data are compiled by IHS Markit for more than 40 economies worldwide. The monthly data are derived from surveys of senior executives at private sector companies, and are available only via subscription. The PMI dataset features a headline number, which indicates the overall health of an economy, and sub-indices, which provide insights into other key economic drivers such as GDP, inflation, exports, capacity utilization, employment and inventories. The PMI data are used by financial and corporate professionals to better understand where economies and markets are headed, and to uncover opportunities.
This article was published by S&P Global Market Intelligence and not by S&P Global Ratings, which is a separately managed division of S&P Global.
{"items" : [
{"name":"share","enabled":true,"desc":"<strong>Share</strong>","mobdesc":"Share","options":[ {"name":"facebook","url":"https://www.facebook.com/sharer.php?u=http%3a%2f%2fprod.azure.ihsmarkit.com%2fmarketintelligence%2fen%2fmi%2fresearch-analysis%2fus-manufacturing-suffers-record-postwar-decline-in-march-amid-covid19-crisis-apr2020.html","enabled":true},{"name":"twitter","url":"https://twitter.com/intent/tweet?url=http%3a%2f%2fprod.azure.ihsmarkit.com%2fmarketintelligence%2fen%2fmi%2fresearch-analysis%2fus-manufacturing-suffers-record-postwar-decline-in-march-amid-covid19-crisis-apr2020.html&text=US+manufacturing+suffers+record+post-war+decline+in+March+amid+COVID-19+crisis+%7c+S%26P+Global+","enabled":true},{"name":"linkedin","url":"https://www.linkedin.com/sharing/share-offsite/?url=http%3a%2f%2fprod.azure.ihsmarkit.com%2fmarketintelligence%2fen%2fmi%2fresearch-analysis%2fus-manufacturing-suffers-record-postwar-decline-in-march-amid-covid19-crisis-apr2020.html","enabled":true},{"name":"email","url":"?subject=US manufacturing suffers record post-war decline in March amid COVID-19 crisis | S&P Global &body=http%3a%2f%2fprod.azure.ihsmarkit.com%2fmarketintelligence%2fen%2fmi%2fresearch-analysis%2fus-manufacturing-suffers-record-postwar-decline-in-march-amid-covid19-crisis-apr2020.html","enabled":true},{"name":"whatsapp","url":"https://api.whatsapp.com/send?text=US+manufacturing+suffers+record+post-war+decline+in+March+amid+COVID-19+crisis+%7c+S%26P+Global+ http%3a%2f%2fprod.azure.ihsmarkit.com%2fmarketintelligence%2fen%2fmi%2fresearch-analysis%2fus-manufacturing-suffers-record-postwar-decline-in-march-amid-covid19-crisis-apr2020.html","enabled":true}]}, {"name":"rtt","enabled":true,"mobdesc":"Top"}
]}


