Customer Logins
Obtain the data you need to make the most informed decisions by accessing our extensive portfolio of information, analytics, and expertise. Sign in to the product or service center of your choice.
Customer Logins
BLOG
Sep 11, 2019
Household income gains slowed but poverty rate fell in 2018
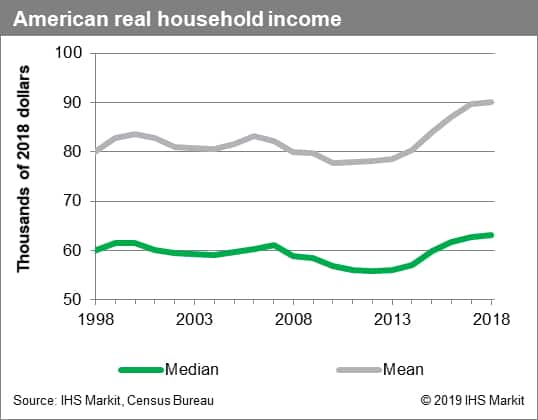
In 2018, real median household income (2018 dollars) grew at the slowest pace in five years. At $63,179, the increase from 2017 was not large enough to pass the test of statistical significance.

Real median household income growth peaked in 2015 at 5.1%, a figure boosted by a pause in consumer price inflation which totaled a mere 0.2% during that year. As inflation steadily accelerated through 2018—with average annual growth of the price index used to calculate real household income hitting 2.4%—real household income growth slowed to a mere 0.9%.

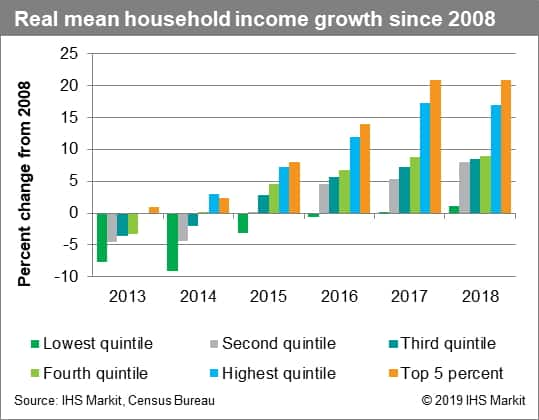
The Great Recession contributed to a decline in real incomes of lower- and middle-class families, and the benefits of the economic expansion since then have been highly uneven across the income distribution. Between 2008 and 2018, average inflation-adjusted income increased by 21% for the top five percent of households by income, while it grew only 1.1% for the bottom twenty percent. According to the revised data in this report, the average real household income for this lowest quintile first surpassed its 2008 level in 2017.
But while the expansion in real household income was slower in 2018, it was also more equitable. In recent years, labor markets have tightened to the point where employers are being forced to compete for available workers. This dynamic is putting upward pressure on wages across the economy, especially in industries with lower average pay. As a result, income growth has picked up for those at the bottom end of the income distribution. In 2018, the middle class was the chief beneficiary: the quintile of households which enjoyed the fastest average real income growth was the group between the 20th and the 40th percentiles, followed by the group between the 40th and the 60th percentiles. Each of the bottom three quintiles outperformed the top two. Indeed, the top one-fifth of households saw real income decrease slightly in 2018.
The result of this broadening of income growth was that the poverty rate continued to fall. The number of people living in poverty in America was 38.1 million in 2018, a 1.4-million decrease from the year before. This decline, the fourth in a row, pushed the poverty rate down 0.5 percentage point. At 11.8% in 2018, the poverty rate was the lowest since 2001 and the third-lowest since 1981.
Labor-market tightness was also evident in other ways. More Americans transitioned to full-time, year-round work in 2018, and more of them were women. The number of full-time, year-round workers increased by 2.3 million, of whom 700,000 were male and 1.6 million were female. The share of working men with earnings who were employed full-time and year-round increased 0.7 percentage point to 76.3%, while that of women grew 1.0 point to 63.9%. Each of these full-time, year-round cohorts registered strong earnings growth as well—3.4% for men and 3.3% for women. But despite the larger number of women joining the ranks of full-timers, the pay gap between men and women was statistically unchanged in 2018 (though it has narrowed over the last decade). Women earned 81.6% as much as men, on average, in 2018.
Health insurance coverage was the major metric that regressed in 2018. The uninsured rate among American households increased 0.5 percentage point to 8.5% in 2018, the first year-to-year increase since 2009. The increase in the number of uninsured was driven mainly by decreases in Medicaid coverage.
Looking ahead, we expect median household income to make further gains in 2019. Tight labor markets are continuing to boost wages across income groups, while consumer price inflation has moderated relative to 2018. These factors will continue to produce more balanced gains across the income distribution and will bolster the fundamentals for consumer spending. The major risks to the consumer spending outlook stem from the escalating trade war, which threatens to raise prices and may rattle consumer confidence ahead of the holiday shopping season.
{"items" : [
{"name":"share","enabled":true,"desc":"<strong>Share</strong>","mobdesc":"Share","options":[ {"name":"facebook","url":"https://www.facebook.com/sharer.php?u=http%3a%2f%2fprod.azure.ihsmarkit.com%2fmarketintelligence%2fen%2fmi%2fresearch-analysis%2fhousehold-income-gains-slowed-poverty-rate-fell-2018.html","enabled":true},{"name":"twitter","url":"https://twitter.com/intent/tweet?url=http%3a%2f%2fprod.azure.ihsmarkit.com%2fmarketintelligence%2fen%2fmi%2fresearch-analysis%2fhousehold-income-gains-slowed-poverty-rate-fell-2018.html&text=Household+income+gains+slowed+but+poverty+rate+fell+in+2018+%7c+S%26P+Global+","enabled":true},{"name":"linkedin","url":"https://www.linkedin.com/sharing/share-offsite/?url=http%3a%2f%2fprod.azure.ihsmarkit.com%2fmarketintelligence%2fen%2fmi%2fresearch-analysis%2fhousehold-income-gains-slowed-poverty-rate-fell-2018.html","enabled":true},{"name":"email","url":"?subject=Household income gains slowed but poverty rate fell in 2018 | S&P Global &body=http%3a%2f%2fprod.azure.ihsmarkit.com%2fmarketintelligence%2fen%2fmi%2fresearch-analysis%2fhousehold-income-gains-slowed-poverty-rate-fell-2018.html","enabled":true},{"name":"whatsapp","url":"https://api.whatsapp.com/send?text=Household+income+gains+slowed+but+poverty+rate+fell+in+2018+%7c+S%26P+Global+ http%3a%2f%2fprod.azure.ihsmarkit.com%2fmarketintelligence%2fen%2fmi%2fresearch-analysis%2fhousehold-income-gains-slowed-poverty-rate-fell-2018.html","enabled":true}]}, {"name":"rtt","enabled":true,"mobdesc":"Top"}
]}


