Customer Logins
Obtain the data you need to make the most informed decisions by accessing our extensive portfolio of information, analytics, and expertise. Sign in to the product or service center of your choice.
Customer Logins
ECONOMICS COMMENTARY
Jan 05, 2022
Global manufacturing production growth accelerates at end of 2021 as supply disruptions show signs of easing, price pressure cools

An unchanged global manufacturing PMI reading in December masked improvements in various sub-indices: factory production growth accelerated, supply disruptions eased, safety stock building was less evident and price pressures abated. Though the impact of the Omicron variant remains highly uncertain, business future expectations also remained largely unchanged, as any concerns over disruptions caused by rising case numbers were largely offset by the improving supply situation and growing hopes that any disruptions would be modest compared to prior waves.
We review the latest PMI sub-index data with 10 key charts.
Global PMI holds steady
The JPMorgan Global Manufacturing PMI, compiled by IHS Markit from its proprietary business surveys, held steady at 54.2 for a third successive month in December. While signalling an encouraging resilience in the overall health of the manufacturing economy in the face of the COVID-19 Omicron variant, the survey's sub-indices, including some of the key components of the PMI itself, brought even better news. These signals are explored more fully in the following ten charts.
Global manufacturing PMI and its five components
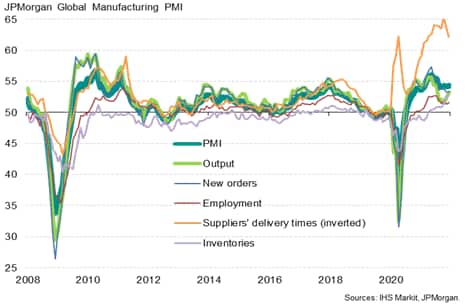
Chart 1: Production growth recovers in line with new orders
December saw growth of factory output accelerate to the fastest since July, broadly matching the expansion of new orders for the first time since February. Whereas in recent prior months production growth had lagged demand growth to an unprecedented degree barring a brief spell in 2009 as factories simply could not produce everything being demanded by their customers, December has seen production and demand growth come back into line.
Global output and new orders growth comparisons
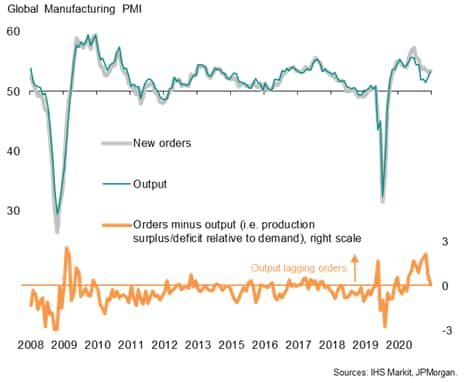
Chart 2: Italy and the US report biggest shortfalls of production, China reports surfeit
The biggest shortfall of production relative to demand was recorded in Italy followed by the US, Australia and South Korea. France, Vietnam, Taiwan, the UK Canada, the Philippines and Germany all also reported production deficits relative to orders. However, the US production deficit was the smallest since February while the eurozone deficit as a whole was the smallest for three months.
In contrast, a surplus of production relative to new orders was seen in Thailand, Indonesia, China, as well as Spain, Japan, Russia and several other central and eastern European economies. Across Asia as a whole, the production surplus was the largest since August 2020.
Production and order book comparisons
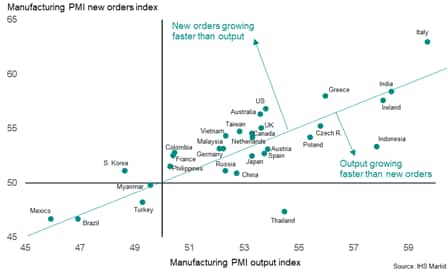
Chart 3: Production constraints ease
The faster output growth (and reduced production shortfall) in December was largely attributable to companies reporting fewer production constraints due to staff or raw material shortages. While the number of companies worldwide reporting that output was constrained by shortages continued to run at 3.5 times the long-run average in December, this is down from a record peak of 4.7 times the long-run average back in October. To underscore the unprecedented extent to which production growth has been curbed by shortages of staff and materials during the pandemic, prior to 2020 this ratio had never risen above 2.0.
Global output constraints
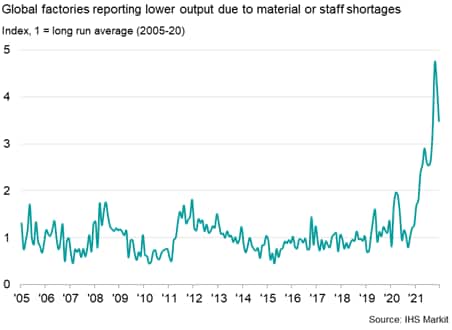
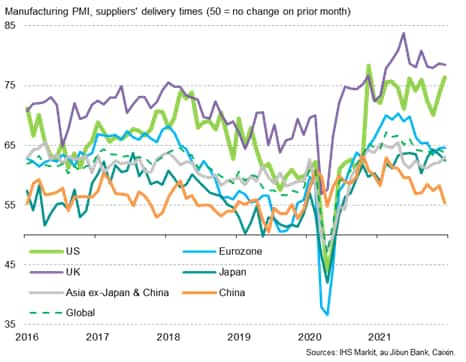
Chart 4: Supplier delivery delays ease to lowest since March
Key to the easing of the production constraints was an alleviation of supplier delivery delays in December. Although still running at a level far in excess of anything seen prior to the pandemic, the average lengthening of supplier delivery times globally eased for a second consecutive month in December to the smallest recorded since March.
In many instances, suppliers had been able to raise capacity to meet demand for inputs from manufacturers, though problems persisted in shipping these goods to factories, with the number of companies reporting shipping delays continuing to run at around eight times the long-run average, pointing to a continued worrying - and unprecedented - logistical issue which remains unresolved. However, even these shipping delays showed some signs of moderating in December.
Global supply and shipping delays
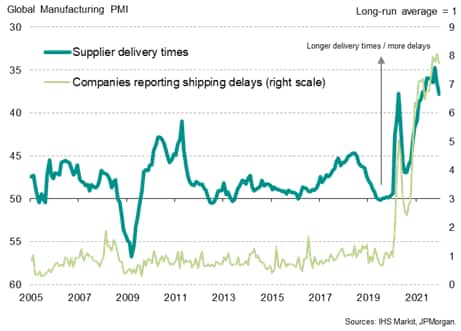
Chart 5: Supplier delays moderate but remain close to all-time highs
Suppliers' delivery times continued to lengthen most notably in the US and Europe, though to significantly lesser extents than in prior months. Delivery lead times lengthened to the least extent for seven months in the US, ten months in the eurozone and 12 months in the UK. The latter nevertheless saw the longest lead-time extension of any country other than the Netherlands, in part reflecting additional issues relating to Brexit.
Far fewer delays were recorded in Asia, with China, in particular, seeing especially modest disruptions to supply chains.
PMI supplier delivery times index
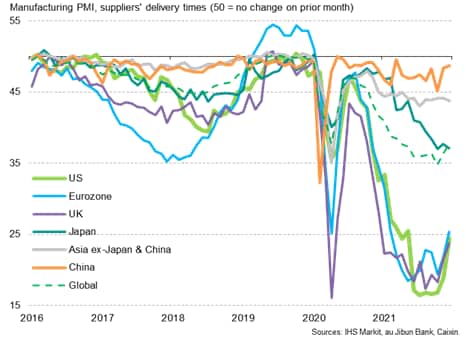
Chart 6: Supply shortages prompt record safety stock building
The ongoing stress on supply chains and shipping times was exacerbated by stock building in December, especially as manufacturers continued to purchase additional inputs in an attempt to safeguard future production. Worldwide inventories of purchased inputs consequently at a new survey record rate for a second successive month, led by a record increase in the eurozone. However, some encouragement from signs of improving supply chains meant that the incidence of safety stock building cooled from November's all-time high, albeit remaining the third highest on record, resulting in lower inventory accumulation rates in the US and Japan.
Global inventory building
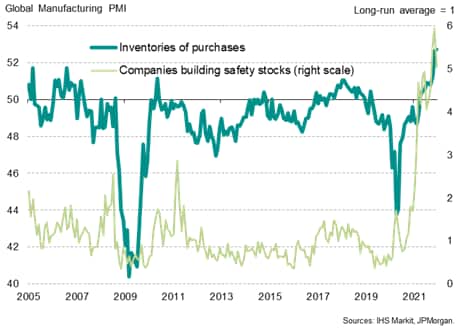
Chart 7: Record input price inflation eases for second month running
An easing in the rate of increase of manufacturers' input costs accompanied the cooling of supply chain pressures. Measured globally, input costs rose at the slowest pace since April, hinting that the rate of increased peaked back in October. It should nevertheless be noted that, although moderating, the rate of input cost inflation remains higher than at any time seen in the ten years prior to the surge seen in the pandemic.
Global manufacturing supply delays and input prices
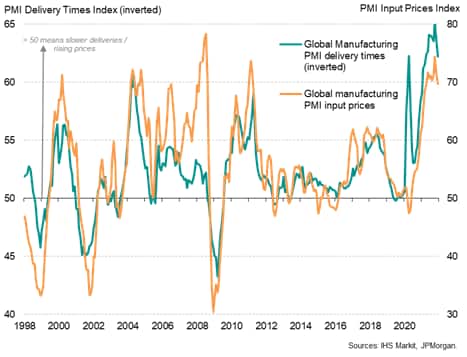
Chart 8: China reports lowest rate of input cost inflation
Input cost inflation rates differed markedly around the world. Most notably, China saw prices barely rise - recording the lowest inflation rate since prices began rising in June 2020 (and the lowest of all economies surveyed in December) as government measures to bring commodity prices down took effect, notably for coal.
Input cost inflation rates also cooled in most other major economies during December, albeit with still elevated rates of increase recorded in the UK, eurozone and US, the principal exceptions being Turkey, Mexico, Malaysia and Australia.
Manufacturing input prices
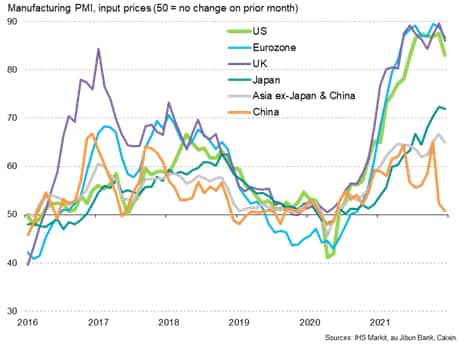
Chart 9: UK bucks trend of lower factory gate price inflation, prices fall in China
Strong regional divergences were also seen for selling price inflation, largely linked to the input cost differentials recorded during the month. Average prices charged for goods leaving the factory gate fell slightly in China for the first time since April 2020 (making it the only economy reporting lower prices in December) and rose at slower - though still elevated - rates in the US and Eurozone (the lowest for eight and six months respectively). Modest easings were also seen in Japan and the rest of Asia.
In contrast, producer selling prices rose at an increased rate in the UK (a rate of increase exceeded only by that seen in Tukey and the Netherlands), taking the rate of inflation to the highest on record.
Manufacturing output prices
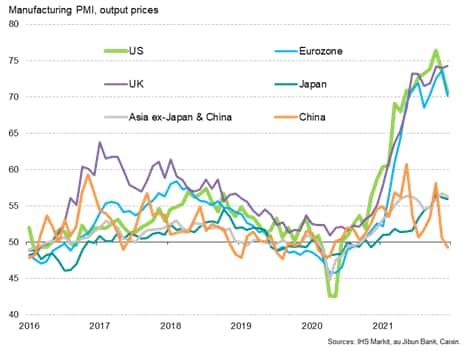
Chart 10: Future expectations show encouraging resilience in face of Omicron
In a month in which the Omicron variant led to a surge in global COVID-19 infections, the global PMI future output expectations index - which tracks firms' own projections of their output in the coming year - showed encouraging resilience. The index dropped from 64.3 in November to 63.7 in December, running below the prior 12-month average of 65.1 but remaining above the long-run average of 62.4 to suggest that firms see few additional disruptions from the Omicron spread.
Future expectations in fact even picked up in the US to the second-highest in nearly six years, linked to the improving supply situation, and lifted slightly higher both in the eurozone and Asia excluding Japan and China. The latter saw a notably marked downturn in expectations for the year ahead. Note that if China was excluded, global business confidence rose in December to the highest since July, with firms often citing fewer concerns over the impact of COVID-19 despite the Omicron variant.
Global manufacturing PMI future expectations
Chris Williamson, Chief Business Economist, IHS Markit
Tel: +44 207 260 2329
chris.williamson@ihsmarkit.com
© 2022, IHS Markit Inc. All rights reserved. Reproduction in whole
or in part without permission is prohibited.
Purchasing Managers' Index™ (PMI®) data are compiled by S&P Global for more than 40 economies worldwide. The monthly data are derived from surveys of senior executives at private sector companies, and are available only via subscription. The PMI dataset features a headline number, which indicates the overall health of an economy, and sub-indices, which provide insights into other key economic drivers such as GDP, inflation, exports, capacity utilization, employment and inventories. The PMI data are used by financial and corporate professionals to better understand where economies and markets are headed, and to uncover opportunities.
This article was published by S&P Global Market Intelligence and not by S&P Global Ratings, which is a separately managed division of S&P Global.
{"items" : [
{"name":"share","enabled":true,"desc":"<strong>Share</strong>","mobdesc":"Share","options":[ {"name":"facebook","url":"https://www.facebook.com/sharer.php?u=http%3a%2f%2fprod.azure.ihsmarkit.com%2fmarketintelligence%2fen%2fmi%2fresearch-analysis%2fglobal-manufacturing-production-growth-accelerates-Jan22.html","enabled":true},{"name":"twitter","url":"https://twitter.com/intent/tweet?url=http%3a%2f%2fprod.azure.ihsmarkit.com%2fmarketintelligence%2fen%2fmi%2fresearch-analysis%2fglobal-manufacturing-production-growth-accelerates-Jan22.html&text=Global+manufacturing+production+growth+accelerates+at+end+of+2021+as+supply+disruptions+show+signs+of+easing%2c+price+pressure+cools+%7c+S%26P+Global+","enabled":true},{"name":"linkedin","url":"https://www.linkedin.com/sharing/share-offsite/?url=http%3a%2f%2fprod.azure.ihsmarkit.com%2fmarketintelligence%2fen%2fmi%2fresearch-analysis%2fglobal-manufacturing-production-growth-accelerates-Jan22.html","enabled":true},{"name":"email","url":"?subject=Global manufacturing production growth accelerates at end of 2021 as supply disruptions show signs of easing, price pressure cools | S&P Global &body=http%3a%2f%2fprod.azure.ihsmarkit.com%2fmarketintelligence%2fen%2fmi%2fresearch-analysis%2fglobal-manufacturing-production-growth-accelerates-Jan22.html","enabled":true},{"name":"whatsapp","url":"https://api.whatsapp.com/send?text=Global+manufacturing+production+growth+accelerates+at+end+of+2021+as+supply+disruptions+show+signs+of+easing%2c+price+pressure+cools+%7c+S%26P+Global+ http%3a%2f%2fprod.azure.ihsmarkit.com%2fmarketintelligence%2fen%2fmi%2fresearch-analysis%2fglobal-manufacturing-production-growth-accelerates-Jan22.html","enabled":true}]}, {"name":"rtt","enabled":true,"mobdesc":"Top"}
]}