Customer Logins
Obtain the data you need to make the most informed decisions by accessing our extensive portfolio of information, analytics, and expertise. Sign in to the product or service center of your choice.
Customer Logins
ECONOMICS COMMENTARY
Oct 03, 2019
Explaining US manufacturing PMI survey divergences

- Manufacturing PMI surveys have diverged, but differences in methodology can help explain the contrasting signals
- ISM data focus on larger multinationals, whereas IHS Markit polls a representative mix of company size
- Both surveys nevertheless indicate manufacturing malaise extended into September
Business surveys sent conflicting signals on the health of the US manufacturing sector in September. But dig deeper and the survey divergences can be explained. Our analysis highlights how the IHS Markit PMI has outperformed the ISM survey in providing more accurate indications of actual manufacturing trends in recent years, most likely due to differences in panel structure and questionnaire design.
Rising or falling?
The IHS Markit Manufacturing PMI™ hit a five-month high in September while the ISM survey's PMI sank to its lowest level since 2009. Moreover, at 51.1. the former indicated a modest improvement in business conditions while the latter, at 47.8, indicated a deterioration.
Both surveys use diffusion indices whereby 50 denotes no change on the previous month. Both headline PMIs are also composite indicators derived from five individual survey questions relating to output, new orders, employment, inventories and suppliers' delivery times. Note however that ISM uses a straight average of its five components whereas IHS Markit uses a system such that forward-looking components carry a higher weight. These weights can therefore lead to divergences between the two PMIs. However, even recalculated using the ISM weighting system, the IHS Markit PMI for September comes in at 50.6. The cause of the divergence must therefore lie elsewhere.
We therefore need to dig deeper into the survey sub-indices rather than analysing the headline PMI numbers. In theory, the sub-indices such as output, new orders and employment should be directly comparable between the two surveys, as they measure the change in each variable from one month to the next over a consistent definition of manufacturing , However, as charts 1, 2 and 3 demonstrate, some large variations have been seen over the survey history.
In particular, the ISM indices ran considerably higher than the IHS Markit indices through 2017 and 2018, and have also tended to show greater volatility over the past 12 years for which data are available for both surveys.
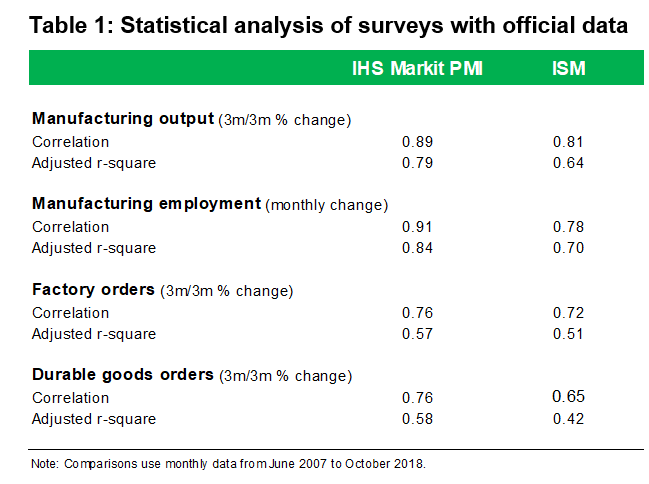
Using some simple statistical analysis, it is evident that the IHS Markit indices have a stronger relationship with official output, factory orders and employment data than the equivalent ISM indices. The IHS Markit data show consistently higher correlation coefficients and adjusted r-squares than the ISM data when compared with a rolling three-month rate of change in comparable official data, which is the most widely used metric for comparing survey data with government statistics (see table 1).
Latest signals
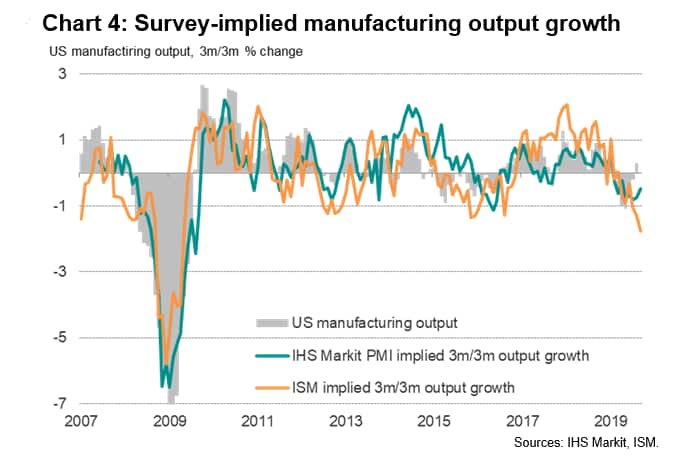
Implied growth rates for manufacturing output, derived from the regressions and shown in chart 4, confirm the extent to which exaggerated growth signals were sent from the ISM surveys over 2017 and 2018. More recently, in 2019 both surveys have signalled falling manufacturing output trends. Note that, although running higher than the ISM data in September, the IHS Markit data are still indicating falling manufacturing output on a three-month-rolling basis, and the 'flash' IHS Markit PMI's output index even fell to its lowest since 2009 back in July, though the rate of contraction has eased slightly. Both surveys are therefore consistent in indicating that the manufacturing recession was most likely extended into the third quarter, but the September divergence remains a concern.
Potential causes of survey divergence
Some clues as to why the ISM and IHS Markit surveys have diverged can be found through a closer inspection of the survey methodologies:
Survey panel sizes are different: IHS Markit's survey panel is larger than the ISM's stated panel size. IHS Markit surveys just under 800 manufacturing companies (approximately double the size of the ISM panel size) from which an 80% response rate is typically received. However, unlike IHS Markit, ISM does not disclose actual numbers of questionnaires received. As a general rule, a large panel size produces more stable and accurate survey results, meaning the data tend to be loss volatile and 'noisy'.
The surveys use different panel structures: ISM data are based only on ISM members, and as such are likely to only reflect business conditions in larger companies, with small- and medium-sized firms under-represented. In contrast, IHS Markit's survey includes an appropriate mix of companies of all sizes (based on official data showing the true composition of manufacturing output).
Survey responses may relate to different markets: ISM also does not ask respondents to confine their reporting to US facilities/factories whereas IHS Markit specifies that all responses must relate only to metrics from US factories. ISM data could therefore be more heavily influenced by conditions of US-owned factories in China, for example, than the IHS Markit data.
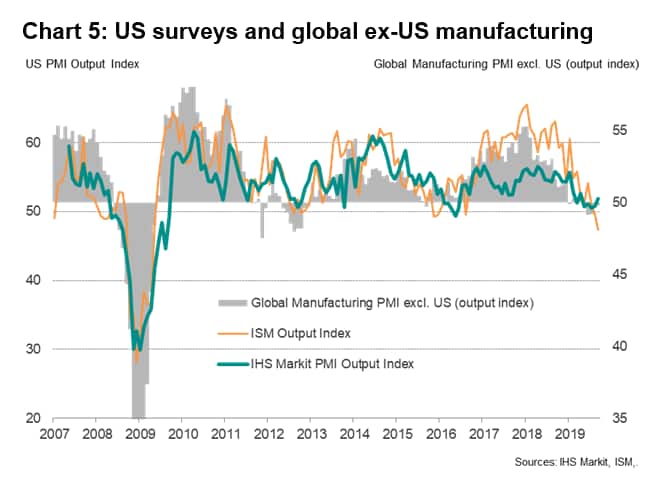
Pull all of the above factors together and it becomes clearer as to why the ISM data may have exaggerated US manufacturing in 2017 and 2018, and why it is now possibly overstating the weakness. As chart 5 shows, global manufacturing growth outside of the US (as tracked by IHS Markit's other PMI surveys) accelerated sharply in 2017, and has since matched the pattern of growth shown by the ISM. More recently, note that global-ex-US growth has slowed sharply to some of the weakest rates seen over the past ten years (albeit not as steep as 2012).
Global vs US
As the ISM data is seemingly more reflective of the performance of multinationals than the IHS Markit survey, we argue that it is sending misleading signals regarding the health of the US economy. A more reliable picture of US manufacturing trends is offered by the IHS Markit survey. Moreover, given the greater volatility of the ISM data relative to the IHS Markit and official data, it is possible that the current steep decline signalled by the ISM simply represents another case of the survey exaggerating the rate of change.
Meanwhile, for those concerned that the ISM may be signalling a global manufacturing downturn, a better insight into global trends is provided by our global PMI, which is based on responses to monthly questionnaires sent to purchasing managers in survey panels in over 40 countries, totalling around 13,500 companies. Coverage includes all major developed and emerging markets which collectively account for 98% of global manufacturing value added.
Want to see the PMI in action and understand where the market is headed?
Request the December 2019 PMI nowcast slides
Chris Williamson, Chief Business Economist, IHS Markit
Tel: +44 207 260 2329
chris.williamson@ihsmarkit.com
© 2019, IHS Markit Inc. All rights reserved. Reproduction in whole or in part without permission is prohibited.
Purchasing Managers' Index™ (PMI™) data are compiled by IHS Markit for more than 40 economies worldwide. The monthly data are derived from surveys of senior executives at private sector companies, and are available only via subscription. The PMI dataset features a headline number, which indicates the overall health of an economy, and sub-indices, which provide insights into other key economic drivers such as GDP, inflation, exports, capacity utilization, employment and inventories. The PMI data are used by financial and corporate professionals to better understand where economies and markets are headed, and to uncover opportunities.
This article was published by S&P Global Market Intelligence and not by S&P Global Ratings, which is a separately managed division of S&P Global.
{"items" : [
{"name":"share","enabled":true,"desc":"<strong>Share</strong>","mobdesc":"Share","options":[ {"name":"facebook","url":"https://www.facebook.com/sharer.php?u=http%3a%2f%2fprod.azure.ihsmarkit.com%2fmarketintelligence%2fen%2fmi%2fresearch-analysis%2fexplaining-us-manufacturing-pmi-survey-divergences-Oct19.html","enabled":true},{"name":"twitter","url":"https://twitter.com/intent/tweet?url=http%3a%2f%2fprod.azure.ihsmarkit.com%2fmarketintelligence%2fen%2fmi%2fresearch-analysis%2fexplaining-us-manufacturing-pmi-survey-divergences-Oct19.html&text=Explaining+US+manufacturing+PMI+survey+divergences+%7c+S%26P+Global+","enabled":true},{"name":"linkedin","url":"https://www.linkedin.com/sharing/share-offsite/?url=http%3a%2f%2fprod.azure.ihsmarkit.com%2fmarketintelligence%2fen%2fmi%2fresearch-analysis%2fexplaining-us-manufacturing-pmi-survey-divergences-Oct19.html","enabled":true},{"name":"email","url":"?subject=Explaining US manufacturing PMI survey divergences | S&P Global &body=http%3a%2f%2fprod.azure.ihsmarkit.com%2fmarketintelligence%2fen%2fmi%2fresearch-analysis%2fexplaining-us-manufacturing-pmi-survey-divergences-Oct19.html","enabled":true},{"name":"whatsapp","url":"https://api.whatsapp.com/send?text=Explaining+US+manufacturing+PMI+survey+divergences+%7c+S%26P+Global+ http%3a%2f%2fprod.azure.ihsmarkit.com%2fmarketintelligence%2fen%2fmi%2fresearch-analysis%2fexplaining-us-manufacturing-pmi-survey-divergences-Oct19.html","enabled":true}]}, {"name":"rtt","enabled":true,"mobdesc":"Top"}
]}