Customer Logins
Obtain the data you need to make the most informed decisions by accessing our extensive portfolio of information, analytics, and expertise. Sign in to the product or service center of your choice.
Customer Logins
BLOG
Feb 03, 2016
The evolution of tight and unconventional gas field development
Ask any petroleum engineer about the science of developing tight and unconventional gas. Invariably, the answer will describe an imprecise craft, characterized by precious hard-won knowledge through generations of expensive trial and error. Most companies guard the specifics of their methods in an effort to maintain a competitive advantage.
Stimulation experts who develop the right "recipe" to deliver results in a particular region and/or producing horizon become hot commodities. All of this is undoubtedly valid. In fact, many successful E&P companies have turned tight gas development and production into the Walmart of the oil and gas industry; indeed a very large scale endeavor with paper-thin margins, but highly profitable if done correctly.
Here's the problem. Most of the knowledge and technique acquired seems to be non-transferable. Companies have to (expensively) re-learn the secrets, largely by trial and error, every time they develop a new field. No one has come up with a magic formula for optimally developing a "generic" tight gas field, as it seems there are just too many variables and uncertainties in the equation. Instead, millions of dollars are often spent, following a decision of the type "Over there, they're drilling fractured horizontal wells on 40-acre spacing, so that's what we'll do over here". We're not suggesting that there is a magic formula, but what if there was a more systematic and scientific way to approach the optimum development solution?
A few years ago, we set out to try and solve this problem practically and systematically. Fast forward six years and we have IHS Evolution, not a magic bullet, but a practical tool that serves a specific purpose: "Identify the best development strategy using the information available". The primary value-added is that the program can narrow down a vast range of possibilities very easily and quickly, without tedious reservoir simulation or exhaustive economic runs.
The objective of IHS Evolution is to answer the following questions:
- How many wells, and of what type, are needed to optimally develop the field?
- When and where should they be drilled?
To answer the above questions, we need to define the metrics for what is considered "optimal". All companies have different definitions for this. However, in the end, it almost always comes down to simple economics. In IHS Evolution, there are two main metrics that we investigate:
- Total Field Recovery as a function of Number of Wells Drilled
- Net Present Value as a function of Number of Wells Drilled
(other net profit indicators may also be evaluated)
Over and above anything else IHS Evolution is a scoping tool. The software is capable of running, comparing and testing sensitivities on a large number of simulated scenarios very quickly and efficiently.
The user begins with a problem that is often vaguely defined and contains a vast number of possible solutions, and following the workflow within the software, successively narrows it down to a handful of very specific, detailed solutions.
To illustrate the software and workflow, let's consider the following example:
Operator X has acquired new acreage offsetting a large tight gas development. Infrastructure is limited, but well performance data and static reservoir data are plentiful in the offsetting regions. Operator X is not capital constrained, and is interested in finding the most profitable plan to develop the new acreage.
- Area to consider - 1 section (640 acres)
- Expected reservoir pressure = 5,000 psia
- Volumetric parameters:
- h = 25 feet
- porosity = 12%
- sw = 25%
Well performance analysis of 100 offsetting producers (using IHS RTA) suggests an average permeability of 0.01 md, with an average fracture half-length of 250 feet.
Operator X is interested in investigating the following:
- How many wells should be drilled to achieve a total field recovery factor of at least 70 percent, over 20 years?
- What is the most profitable well spacing scenario?
- What is the optimum field production plateau rate, given that infrastructure will be expensive (letting all the wells flow unrestricted from day 1 is unrealistic)?
- What is the optimum drilling schedule to achieve the desired field plateau production rate?
- What effect does uncertainty in input parameters have on the results?
IHS Evolution allows us to get a handle on these questions by investigating and comparing a large number of development scenarios very quickly.
We start by populating the analytical reservoir / well model with the known data. The program then runs multiple total field forecasts for a range of well spacing schemes, at predefined operating conditions.
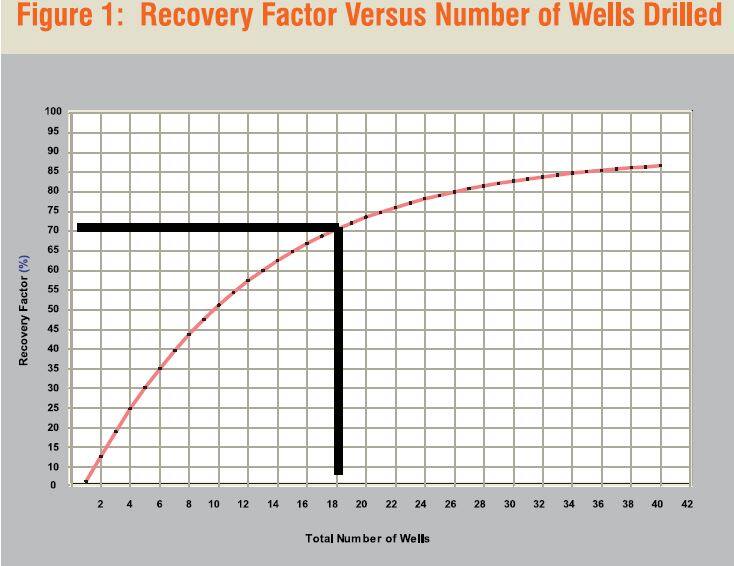
The resulting plot of Recovery Factor versus Number of Wells Drilled is shown in Figure 1.
From Figure 1, we can see that Operator X needs to drill at least 18 wells to recover 70% of the Original Gas-in-Place (OGIP) over 20 years.
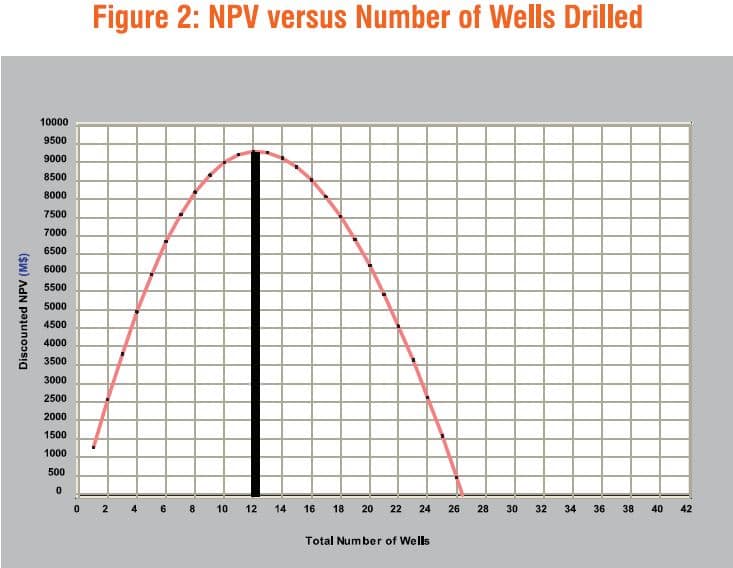
Next, we enter some basic economic parameters, such as capital costs (well, gathering system, etc.), operating costs, gas price and discount rate. Once these have been applied to the production forecasts, IHS Evolution can quantify the Net Present Value (NPV) of each scenario. The result is shown in Figure 2.
Unlike Figure 1, Figure 2 shows a clear maximum value, beyond which NPV declines, suggesting for the specified economic parameters, the field is most profitable with only 12 wells drilled, rather than 18.
To answer question three, we can use IHS Evolution to run an alternative series of forecasts, where a pre-specified maximum field production rate is enforced. This maximum rate plateau qmax) will restrict the total production from the field and reduce the capital cost of facilities (compression, transmission…) thus making more efficient utilization of installed facilities. IHS Evolution automatically estimates the horsepower required for any qmax, and accounts for installed compression costs through a user specified dollar per horsepower amount. Figure 3 compares three different NPV curves including the unrestricted case and two different qmax cases.
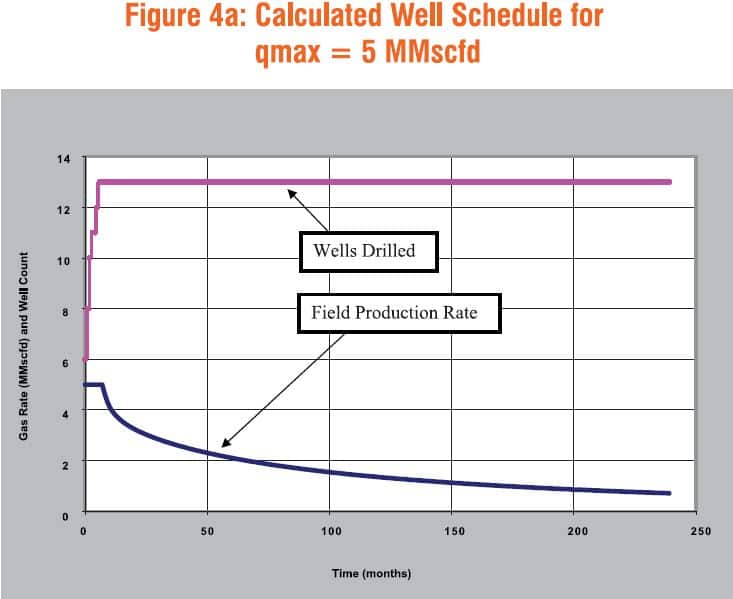
Figure 3 suggests that the optimum field development scenario consists of drilling 13 wells with a maximum rate limitation of 5 MMscfd for the field. If the Operator decides to drill 13 wells and limit the maximum deliverability to 5 MMscfd, the obvious next question is when to drill these wells so as to maintain qmax. Clearly, there is no need to drill all 13 of them at time zero because, initially, the deliverability is being restricted to qmax. IHS Evolution answers this question using a sophisticated analytical reservoir model that accounts for the interference among wells, and will also automatically determine the proper scheduling to meet the defined field rate.
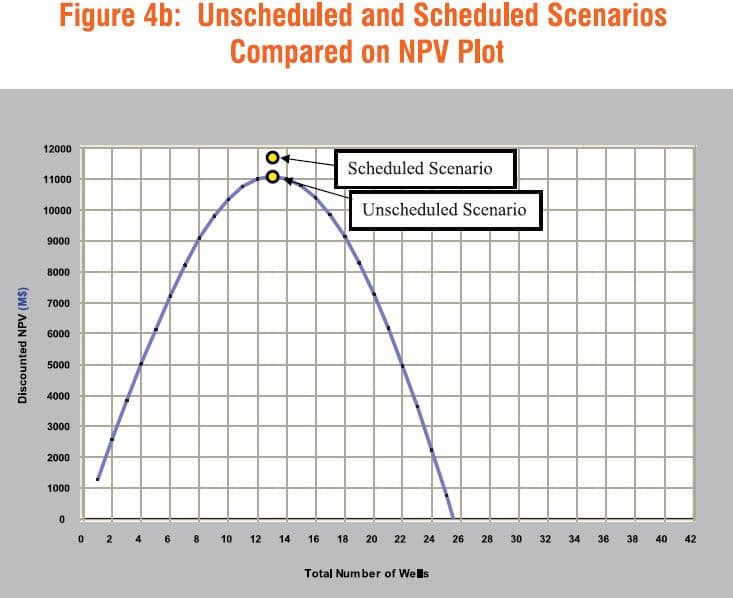
Figure 4a shows the resulting well schedule and deliverability forecast. Figure 4b shows a comparison of the NPVs for the unscheduled and scheduled scenarios.
As indicated in Figure 4b, the Scheduled Scenario yields the higher NPV.
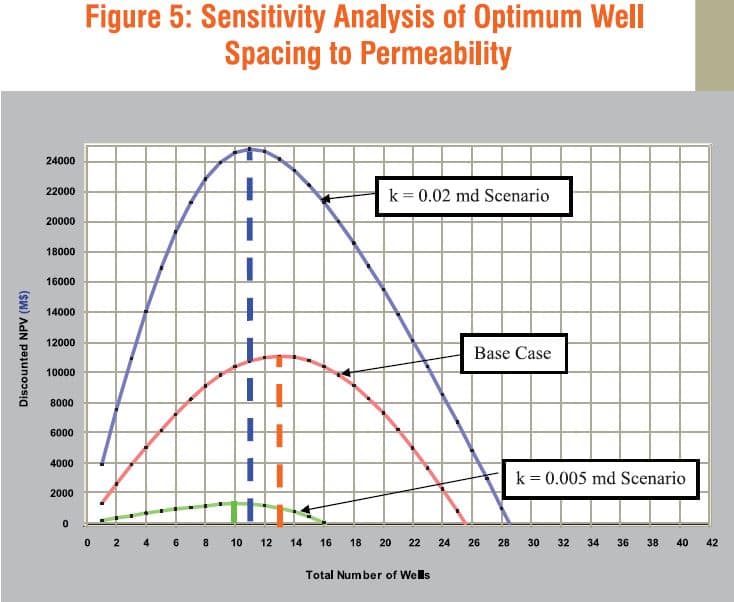
Perhaps the most important thing to consider during this scoping process is the uncertainty in the input parameters. IHS Evolution can evaluate this by quickly generating sensitivity scenarios for any reservoir or well parameter of interest. For example, let's say that Operator X wants to test the sensitivity of optimum well spacing to a predefined uncertainty in permeability. Figure 5 compares three NPV scenarios including the base case (k = 0.01 md), low case (k = 0.005 md) and high case (k = 0.02 md).
Figure 5 suggests that there is very little variation in the optimum well spacing - from 10 to 11 wells - between low and high cases, while the base case shows an optimum of 13.
However, the range of permeability investigated shows a huge effect on the NPV.
In summary, we began with some basic reservoir, well and economic data, but little or no direction. Using IHS Evolution, we were able to quickly and systematically find an optimum development strategy for this undrilled acreage.
David Anderson, Fekete Associates Inc.
Posted 3 February 2016
This article was published by S&P Global Commodity Insights and not by S&P Global Ratings, which is a separately managed division of S&P Global.
{"items" : [
{"name":"share","enabled":true,"desc":"<strong>Share</strong>","mobdesc":"Share","options":[ {"name":"facebook","url":"https://www.facebook.com/sharer.php?u=http%3a%2f%2fprod.azure.ihsmarkit.com%2fcommodityinsights%2fen%2fci%2fresearch-analysis%2frpe-the-evolution-of-tight-and-unconventional-gas-field-development.html","enabled":true},{"name":"twitter","url":"https://twitter.com/intent/tweet?url=http%3a%2f%2fprod.azure.ihsmarkit.com%2fcommodityinsights%2fen%2fci%2fresearch-analysis%2frpe-the-evolution-of-tight-and-unconventional-gas-field-development.html&text=The+evolution+of+tight+and+unconventional+gas+field+development","enabled":true},{"name":"linkedin","url":"https://www.linkedin.com/sharing/share-offsite/?url=http%3a%2f%2fprod.azure.ihsmarkit.com%2fcommodityinsights%2fen%2fci%2fresearch-analysis%2frpe-the-evolution-of-tight-and-unconventional-gas-field-development.html","enabled":true},{"name":"email","url":"?subject=The evolution of tight and unconventional gas field development&body=http%3a%2f%2fprod.azure.ihsmarkit.com%2fcommodityinsights%2fen%2fci%2fresearch-analysis%2frpe-the-evolution-of-tight-and-unconventional-gas-field-development.html","enabled":true},{"name":"whatsapp","url":"https://api.whatsapp.com/send?text=The+evolution+of+tight+and+unconventional+gas+field+development http%3a%2f%2fprod.azure.ihsmarkit.com%2fcommodityinsights%2fen%2fci%2fresearch-analysis%2frpe-the-evolution-of-tight-and-unconventional-gas-field-development.html","enabled":true}]}, {"name":"rtt","enabled":true,"mobdesc":"Top"}
]}

