Customer Logins
Obtain the data you need to make the most informed decisions by accessing our extensive portfolio of information, analytics, and expertise. Sign in to the product or service center of your choice.
Customer Logins
BLOG
Jun 04, 2020
Rate Transient Analysis and Numerical Simulation for Under Bubble Point Reservoir
Rate Transient Analysis (RTA) is a modern tool to better understand the capacity of a reservoir. The combination of measured pressure and rate in addition to the relevant analysis structure can lead to estimation of reserves in place. From productivity index and flow equation to flowing material balance model, the total reservoir structure can be observed and the reservoir behavior can be recognized.
Rate transient analysis is science of analyzing production data. In addition to observation of original oil and gas in place, the tool can be used to predict the future behavior of pressure and rate production. The modelling pressure and rates can be used to forecast the reservoir performance and its applicability. RTA can be defined as a modern decline curve analysis method. DCA method is one of the oldest and most often used tools of the petroleum engineers. This is a forecasting technique which predicts by history matching of rate-time data on an appropriate typecurve. What direction to take, what typecurve(s) to choose and where the rate-time data should fit are decided based on basic reservoir engineering concepts and knowledge (Fetkovich 1980; Fetkovich et al. 1987). So DCA is not based on applying a purely empirical equation to be analyzed with statistical approaches which often leads to unrealistic and unreliable forecast and reserve estimate (Fetkovich et al. 1996). RTA also gives convincing estimates of reservoir parameters with available low-frequency (daily, weekly or monthly) production data. Once reservoir characteristics are determined using RTA, a reservoir model is then constructed to forecast future production scenarios (Mishra 2014; Mireault and Dean 2007-2008).
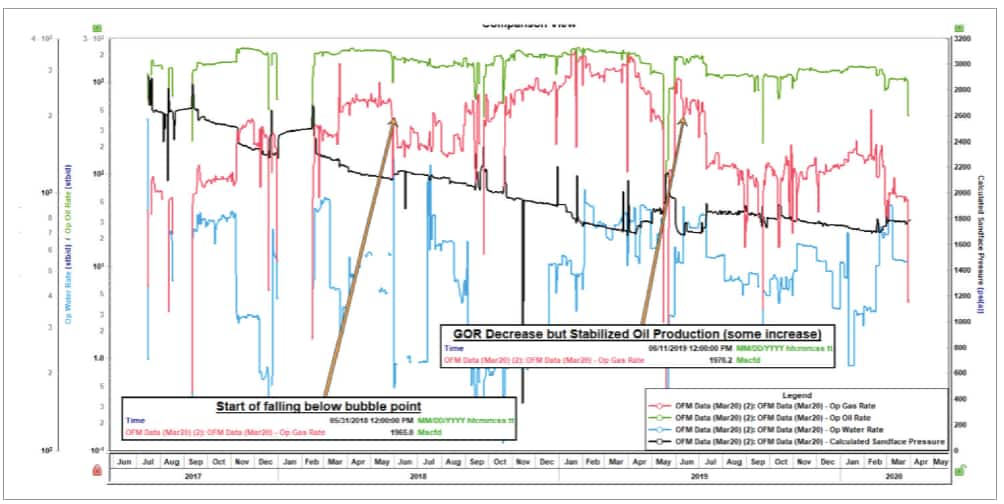
In this case study, an oil well has been observed having reducing trend of GOR. While the pressure having the same declining trend, oil has been stabilized and on some occasions the oil production has a substantial increase. The reservoir pressure is estimated to be 2900psia while the bubble point is 2600psia. The close distance between bubble point and reservoir pressure has led the production falls below the bubble point and release of gas. Now, the question is 'are these gas molecule being produced'? The answer to this questions requires RTA as of below.
Figure 1: Diagnostic Plot
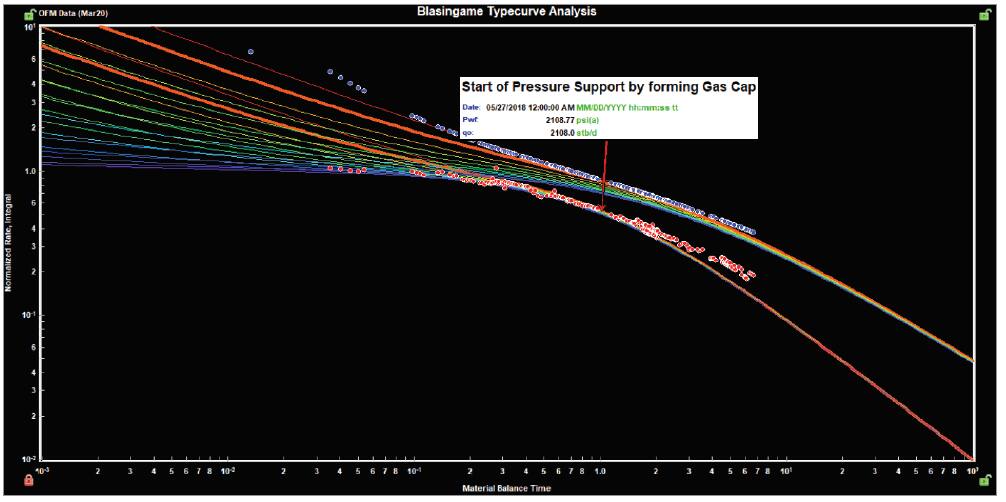
The gas has been released but has led to the increase of oil rate which has been confirmed by the Blasingame type curve. At the same time, gas rate on the surface has been decreased (GOR decrease) and therefore concluded that gas cap is being formed.
Figure 2: Blasingame Type Curve Analysis
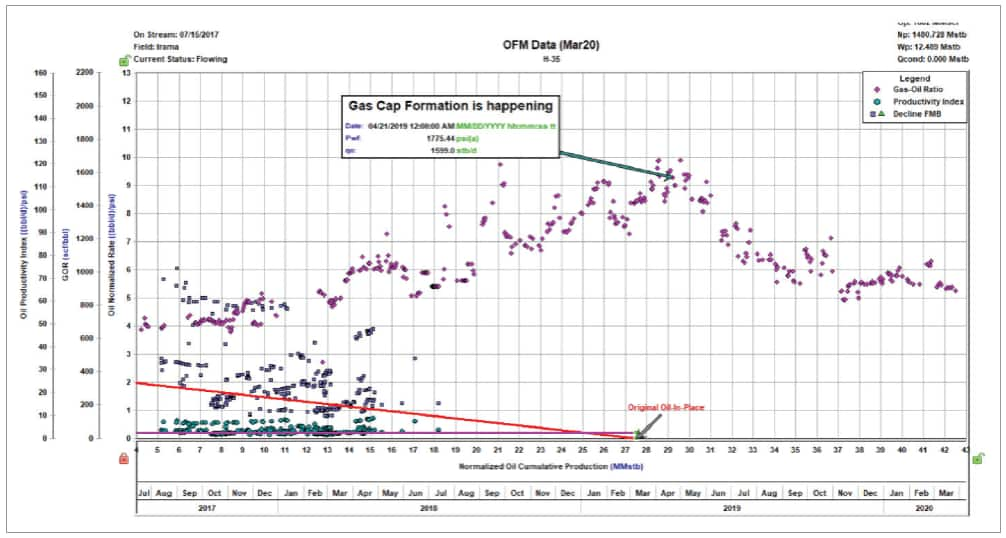
The assumption of having the gas cap and the relevant in place volume has been confirmed by flowing material balance model as of below.
Figure 3: Flowing Material Balance and GOR
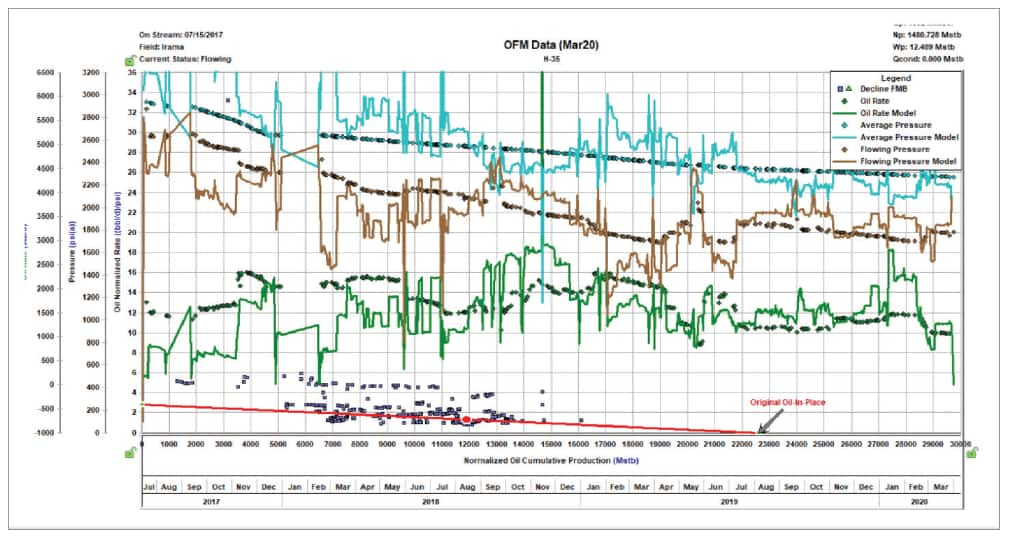
Based on the gas cap formation the model has been created on FMB and pressure as well as rate has been matched which has led to 22.5MMSTB original oil in place volume.
Figure 4: Flowing Material Balance and Model Match (Estimation of OIIP)
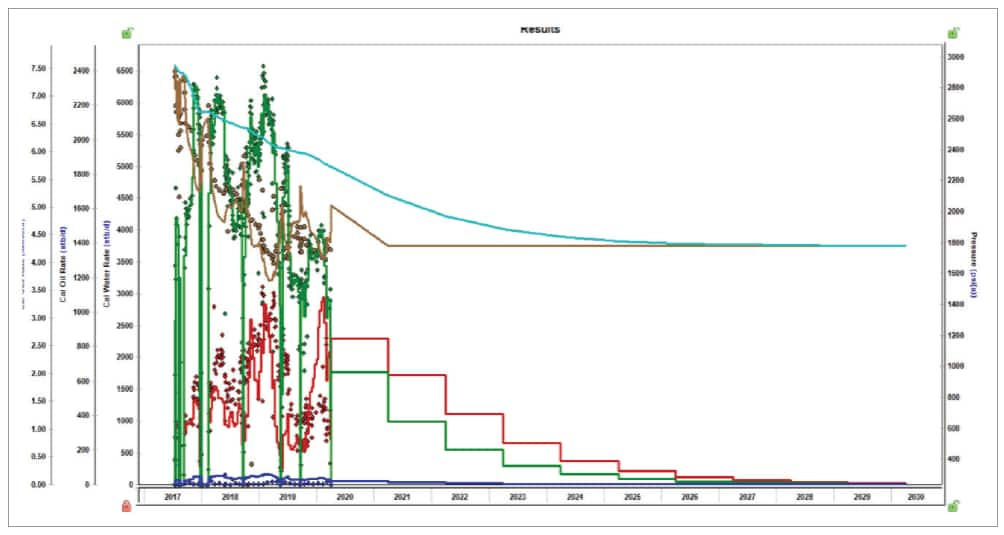
Based on the RTA tank size and the original in place volume, numerical simulation model is created while having the pressure and rates matched. The match has led to prediction of production for this well for the next 10 years.
Figure 5: Numerical Simulation History Match and Prediction
The figure above shows that the gas will be produced eventually, which is leading to the fact that the critical saturation for gas cap will be met.
In conclusion, Harmony Enterprise software has led to proving realization of gas cap which is the second source of energy in the reservoir and can give rise to maintain extra access to proven reserves. All the mentioned process ca has taken time of 3hrs in which is considered very fast processing and simulation task for this field.
Ali Zolalemin is a Reservoir Technical Advisor at IHS Markit.
Posted 04 June 2020
This article was published by S&P Global Commodity Insights and not by S&P Global Ratings, which is a separately managed division of S&P Global.
{"items" : [
{"name":"share","enabled":true,"desc":"<strong>Share</strong>","mobdesc":"Share","options":[ {"name":"facebook","url":"https://www.facebook.com/sharer.php?u=http%3a%2f%2fprod.azure.ihsmarkit.com%2fcommodityinsights%2fen%2fci%2fresearch-analysis%2frate-transient-analysis-and-numerical-simulation.html","enabled":true},{"name":"twitter","url":"https://twitter.com/intent/tweet?url=http%3a%2f%2fprod.azure.ihsmarkit.com%2fcommodityinsights%2fen%2fci%2fresearch-analysis%2frate-transient-analysis-and-numerical-simulation.html&text=Rate+Transient+Analysis+and+Numerical+Simulation+for+Under+Bubble+Point+Reservoir+%7c+S%26P+Global+","enabled":true},{"name":"linkedin","url":"https://www.linkedin.com/sharing/share-offsite/?url=http%3a%2f%2fprod.azure.ihsmarkit.com%2fcommodityinsights%2fen%2fci%2fresearch-analysis%2frate-transient-analysis-and-numerical-simulation.html","enabled":true},{"name":"email","url":"?subject=Rate Transient Analysis and Numerical Simulation for Under Bubble Point Reservoir | S&P Global &body=http%3a%2f%2fprod.azure.ihsmarkit.com%2fcommodityinsights%2fen%2fci%2fresearch-analysis%2frate-transient-analysis-and-numerical-simulation.html","enabled":true},{"name":"whatsapp","url":"https://api.whatsapp.com/send?text=Rate+Transient+Analysis+and+Numerical+Simulation+for+Under+Bubble+Point+Reservoir+%7c+S%26P+Global+ http%3a%2f%2fprod.azure.ihsmarkit.com%2fcommodityinsights%2fen%2fci%2fresearch-analysis%2frate-transient-analysis-and-numerical-simulation.html","enabled":true}]}, {"name":"rtt","enabled":true,"mobdesc":"Top"}
]}

