Customer Logins
Obtain the data you need to make the most informed decisions by accessing our extensive portfolio of information, analytics, and expertise. Sign in to the product or service center of your choice.
Customer Logins
BLOG
Sep 03, 2014
Optimizing well spacing for shale plays with rate transient analysis
Accurate production forecasting is critical to field development well spacing decisions and economic returns.
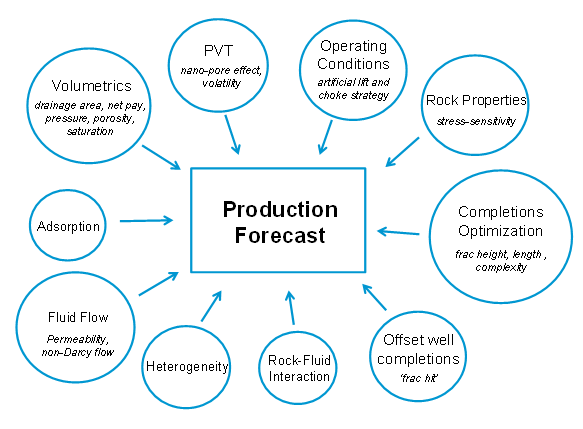
Production forecasting uncertainty is a barrier to making the best field development decisions. Well spacing in shale plays can have a significant impact on estimated ultimate recovery (EUR) and recovery factor (RF). These are axioms which are either lost or undervalued by many operators. In comparison to conventional reservoirs, shale plays introduce many more factors that influence long-term production forecasting behavior, as shown in Figure 1. Changes to completion or well spacing can vastly improve an operator’s capital efficiencies and increase the rate of return on a project.
Figure 1. Factors impacting a shale well production forecast
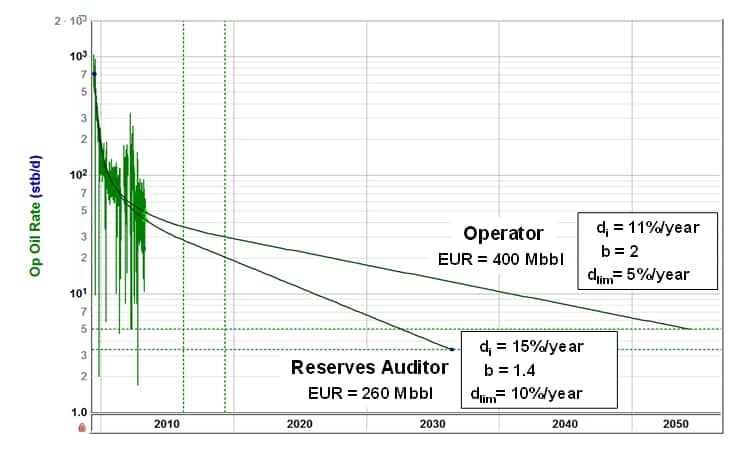
Often engineers must rely solely on decline curve analysis (DCA) to obtain EUR with a poor understanding of hydrocarbon volume-in-place for determining RF. However, the popularity of this technique is easily understood; it is a simple rate-time analysis method that can be applied quickly with a proven track record for conventional well forecasting. DCA is also still considered the standard technology for performance assessment and reserves estimation in unconventional resources. However, how reasonable are its results for shale wells? Recently established rules-of-thumb for the application of DCA to shale varies within industry with most operators taking a very optimistic outlook and most reserve auditors insisting on something far more conservative, as illustrated in Figure 2. The gap between these two camps is typically quite large, and they often battle over differences in EUR by a factor of 2 or more! It is the inherent ambiguity of curve extrapolation and rate history selection that contribute to this difference of opinion.

Figure 2. DCA production forecast comparison – a hypothetical example of operator versus auditor
Ultimately, reserves reporting must pass the scrutiny of the US Securities Exchange Commission (SEC). The SEC demands the application of “reliable technology” to estimate reserves, but given the lack of available shale well production history (less than 6 years on most plays), there’s simply not enough data to prove any technology reliable. Well then, it’s a good thing that we at least have some analog wells with a few years of history, right? Wrong – drilling and completions strategies have been evolving so rapidly for shale, it’s a struggle to accept many of these older wells as suitable analogs. It is common knowledge that a single fracture stage from a multi-fractured horizontal well (MFHW) does not produce the equivalent well performance of a single stage from a vertical well. So, how can a 2500 ft lateral, 8-stage, 100 ton/stage, ball-drop, lease holding MFHW pumped with white sand and cross-link gel predict well performance of a 4500 ft lateral, 15-stage, 200 ton/stage, plug-n-perf MFHW pumped with ceramics and slickwater that’s been pad drilled and zipper fracked with offsets just a few hundred feet away? Let’s get serious. Reservoir engineers earn their paychecks by coming up with intelligent ways to normalize wells, but this is no easy task. Experience teaches us that dividing production volume by stage number or lateral length just doesn’t cut it.
So, we look to techniques that at least provide defensible technologies, which rate-pressure-time analysis arguably provides. Also known as Rate Transient Analysis (RTA), this approach is intended to capture more performance behavior elements of unconventional reservoirs through physics-based reservoir modeling. It can therefore accommodate different drilling and completions scenarios (i.e. different reservoir descriptions) in its production forecasting results, which empirical methods fail to address by themselves. For example, if an operator wants to consider the impact of reducing the drainage area assigned to a 10,000 ft lateral MFHW in the Bakken from 320 to 160 acres (1320 to 660 ft well spacing), what would be the effect on the EUR and RF? And what is the production forecast implication if the frac treatment creates larger fracture heights (i.e. greater net pay) than expected. Good luck figuring this out with only a rate-time relationship!
The good news is that those who have access to an abundance of high quality data and advanced analysis tools are in a position to make better decisions than their disadvantaged competitors, including that stubborn colleague internally. Think of it this way – if performance assessment and reserves estimation were an Olympic sport, RTA would be a performance-enhancing substance.
Combining rate-pressure history with a few input parameter distributions from our friends in the geosciences (yes, we must all get along now), a practical, probabilistic RTA model-based approach can be used to deliver meaningful production forecasting results that accommodate the constraints imposed by drilling programs, completions decisions and interpreted geology. And while this technology needs reliable flowing pressure data to provide its greatest impact, all is not lost if pressure data is sparse or absent, as often reasonable assumptions can still be made to carry out the workflow; details for which are available in SPE paper 155737.
Harnessing this information can provide internal development and reserve booking opportunities that can greatly increase a corporate bottom line as well as helping to identify excellent undervalued targets for acquisition. The corollary of course is that some operating companies might get exposed for overbooking reserves, making them only marketable to those without this knowledge.
Learn more about RTA and IHS Harmony software.
Posted 3 September 2014
This article was published by S&P Global Commodity Insights and not by S&P Global Ratings, which is a separately managed division of S&P Global.
{"items" : [
{"name":"share","enabled":true,"desc":"<strong>Share</strong>","mobdesc":"Share","options":[ {"name":"facebook","url":"https://www.facebook.com/sharer.php?u=http%3a%2f%2fprod.azure.ihsmarkit.com%2fcommodityinsights%2fen%2fci%2fresearch-analysis%2foptimizing-well-spacing-for-shale-plays-with-rate-transient-analysis.html","enabled":true},{"name":"twitter","url":"https://twitter.com/intent/tweet?url=http%3a%2f%2fprod.azure.ihsmarkit.com%2fcommodityinsights%2fen%2fci%2fresearch-analysis%2foptimizing-well-spacing-for-shale-plays-with-rate-transient-analysis.html&text=Optimizing+well+spacing+for+shale+plays+with+rate+transient+analysis","enabled":true},{"name":"linkedin","url":"https://www.linkedin.com/sharing/share-offsite/?url=http%3a%2f%2fprod.azure.ihsmarkit.com%2fcommodityinsights%2fen%2fci%2fresearch-analysis%2foptimizing-well-spacing-for-shale-plays-with-rate-transient-analysis.html","enabled":true},{"name":"email","url":"?subject=Optimizing well spacing for shale plays with rate transient analysis&body=http%3a%2f%2fprod.azure.ihsmarkit.com%2fcommodityinsights%2fen%2fci%2fresearch-analysis%2foptimizing-well-spacing-for-shale-plays-with-rate-transient-analysis.html","enabled":true},{"name":"whatsapp","url":"https://api.whatsapp.com/send?text=Optimizing+well+spacing+for+shale+plays+with+rate+transient+analysis http%3a%2f%2fprod.azure.ihsmarkit.com%2fcommodityinsights%2fen%2fci%2fresearch-analysis%2foptimizing-well-spacing-for-shale-plays-with-rate-transient-analysis.html","enabled":true}]}, {"name":"rtt","enabled":true,"mobdesc":"Top"}
]}
